

HOT TOPICS LIST
- MACD
- Fibonacci
- RSI
- Gann
- ADXR
- Stochastics
- Volume
- Triangles
- Futures
- Cycles
- Volatility
- ZIGZAG
- MESA
- Retracement
- Aroon
INDICATORS LIST
LIST OF TOPICS
PRINT THIS ARTICLE
by Mark Rivest
The S&P 500 reaches major price resistance on a cycle turn date.
Position: Sell
Mark Rivest
Independent investment advisor, trader and writer. He has written articles for Technical Analysis of Stocks & Commodities, Traders.com Advantage,Futuresmag.com and, Finance Magnates. Author of website Four Dimension Trading.
PRINT THIS ARTICLE
MARKET TIMING
Convergence of Price and Time
06/07/17 04:57:56 PMby Mark Rivest
The S&P 500 reaches major price resistance on a cycle turn date.
Position: Sell
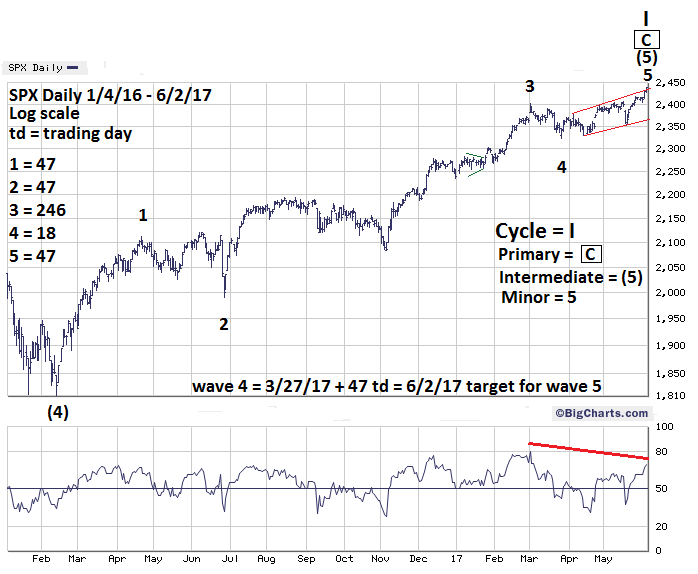
| June 2, 2017 could be a very important date in stock market history. The S&P 500 (SPX) came very close to two long term Fibonacci price coordinates on a Fibonacci time cycle turn day. One of the price coordinates is derived from a pattern six years ago -- implying at least an intermediate degree turn lasting several months. When price targets are reached on target dates it increases the probabilities of a market turn. Price and Time Dimensions My March 15 article "Discovering Fibonacci Price Targets" and my May 10 article, "The Price is Right", noted two long term Fibonacci price coordinates at SPX 2454.10 and 2459.30, derived from price patterns made six and two years ago. When using Fibonacci price analysis allow for leeway, especially with multiyear coordinates. The SPX high on June 2 at 2440.23 is only a half percent away from the 2454.10 long term target, within reasonable leeway for a multiyear target. Hitting precise Fibonacci price targets is more likely with time frames less than two years. Please see the daily SPX chart illustrated in Figure 1. It appears that Minor wave "5" up from the March 27 bottom could be a rare Elliott wave Expanding Diagonal Triangle. Within an Elliott five wave impulse pattern, wave "one" is usually related to wave "five" by the ratios of 1/1 - 1.00, or 3/5 - .618, or 2/5 - .382. The SPX Minor wave "2" correction April to June 2016 exceeded the termination point of Minor wave "1". In this instance we use the SPX high of 2120.55 on June 8 to calculate the distance for Minor wave "1" which began at SPX 1810.10. 310.45 X .382 = 118.59 + Minor wave "4" bottom of 2322.25 targets SPX 2440.84. Almost an exact hit of the actual high on June 2 of 2440.23! My April 12 article "Termination Date" noted that each Minor wave from the February 11, 2016 bottom are related by Fibonacci time ratios, and projected June 2 as the termination date for Minor wave "5". |
|
| Figure 1. The SPX high on June 2 was 2440.23 which is only a half percent away from the 2454.10 long term target, within reasonable leeway for a multiyear target. |
| Graphic provided by: BigCharts.com. |
| |
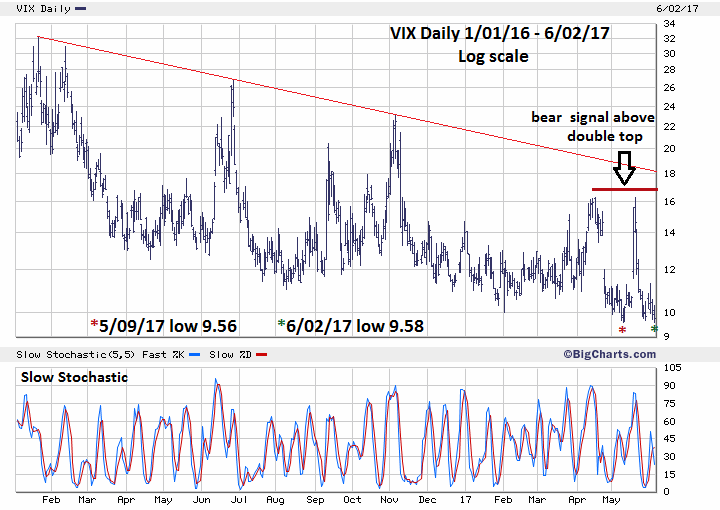
| Sentiment Dimension In the last few months the VIX has given reliable short-term SPX signals. My May 31 article "The Bear Awakens" noted a double VIX spike above the upper Bollinger band on May 17-18 as a possible signal for an SPX bottom. Please see the daily VIX chart illustrated in Figure 2. On June 2 with the SPX at an all-time high the VIX had a marginal divergence vs. its May 9 levels. This implies at least an SPX near term peak. If the VIX were to move below its May 9 level this would be bullish for the SPX and imply stocks could continue to rally. Keep watching the VIX. |
|
| Figure 2. On June 2 with the SPX at an all-time high, the VIX had a marginal divergence vs. its May 9 levels. This implies at least an SPX near-term peak. |
| Graphic provided by: BigCharts.com. |
| |
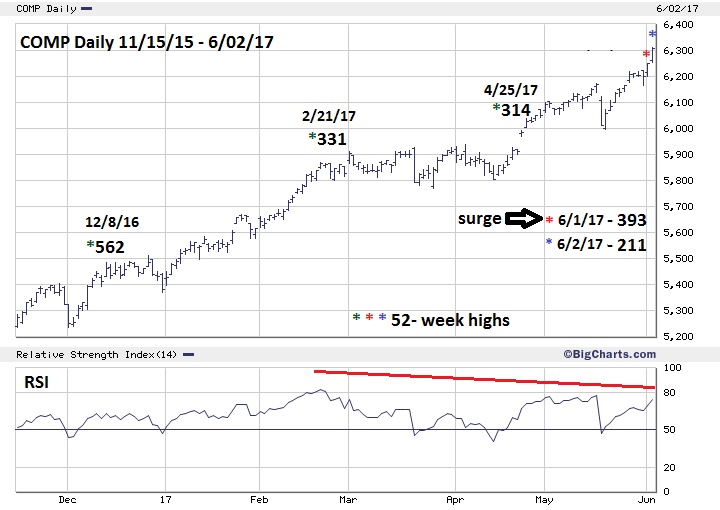
| Momentum Dimension Please see the daily Nasdaq Composite (COMP) chart illustrated in Figure 3. This is an update to the chart illustrated in my May 18 article "Stock Market into the Cross Hair". Note that while still showing a deterioration of new 52-week highs from the December 2016 level, there was a surge on June 1. This surge implies there could be more upside action for the COMP. Short term, if the SPX begins a decline on June 5 and continues down for the next few weeks, COMP would likely also move down. However, the next SPX rally would probably fail to make a new high while the COMP makes a new all-time high. This could be like what happened on July 20, 2015 when the COMP made a new all-time high unconfirmed by the SPX and Dow Jones Industrial Average which both made their respective peaks in May 2015. For more information about the technical condition of the US stock market in July 2015 please see my July 30, 2015 article "A Ludicrous Non-Conformation". Perhaps in a few weeks there could be another ludicrous non-confirmation. |
|
| Figure 3. Note that while still showing a deterioration of new 52-week highs from the December 2016 level, there was a surge on June 1. |
| Graphic provided by: BigCharts.com. |
| |
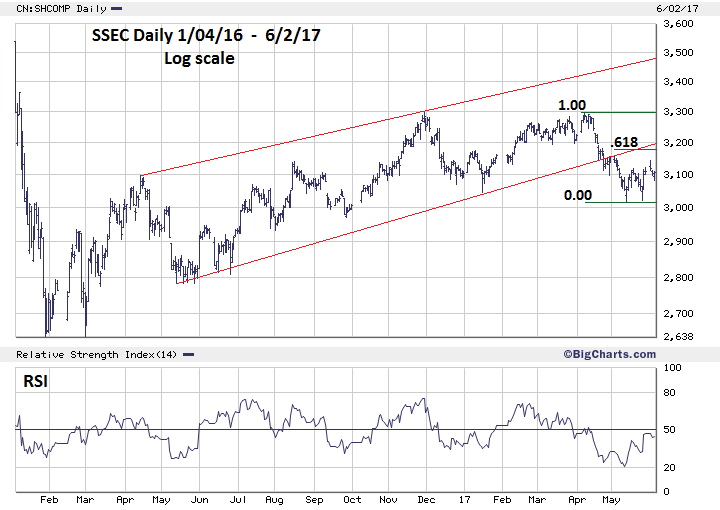
| Shanghai Composite Update Please see the daily Shanghai Composite (SSEC) chart illustrated in Figure 4. This is an update to the SSEC chart illustrated in my May 31 article. The SSEC is approaching what could be serious resistance at the .618 retracement of the last decline -- 3188.70 which is close to the rising trend line. The SSEC has been very weak relative to the global stock market. This could be an early sign of global economic weakness. If the SSEC fails to break above resistance in the upper 3100 area it could be yet another sign of a developing global bear market for stocks. Keep watching the SSEC. |
|
| Figure 4. The SSEC has been very weak relative to the global stock market. This could be an early sign of global economic weakness. |
| Graphic provided by: BigCharts.com. |
| |
| Summary and Strategy Markets rarely have convergence of price and time targets -- powerful evidence that a turn could be imminent. Also, there is ample evidence from the dimensions of Sentiment and Momentum suggesting at least an intermediate degree decline could begin. My May 18 and May 31 articles recommended short 50% stocks if the SPX moved above 2420. The reason for SPX 2420 as opposed to 2454 or 2459 was to allow for leeway. The SPX exceeded 2420 on June 1, 2017. Hold short 50% stock and use SPX 2510 as a stop loss. If Minor wave "5" did form an Expanding Diagonal Triangle there could be a sharp drop in possibly just one week back to the Minor Wave "4" low in the 2320 area. Further Reading: Frost A.J and Robert Prechter (1985) "Elliott Wave Principle", New Classics Library. |
Independent investment advisor, trader and writer. He has written articles for Technical Analysis of Stocks & Commodities, Traders.com Advantage,Futuresmag.com and, Finance Magnates. Author of website Four Dimension Trading.
| Website: | www.fourdimensiontrading.com |
| E-mail address: | markrivest@gmail.com |
Click here for more information about our publications!
Comments

Request Information From Our Sponsors
- StockCharts.com, Inc.
- Candle Patterns
- Candlestick Charting Explained
- Intermarket Technical Analysis
- John Murphy on Chart Analysis
- John Murphy's Chart Pattern Recognition
- John Murphy's Market Message
- MurphyExplainsMarketAnalysis-Intermarket Analysis
- MurphyExplainsMarketAnalysis-Visual Analysis
- StockCharts.com
- Technical Analysis of the Financial Markets
- The Visual Investor
- VectorVest, Inc.
- Executive Premier Workshop
- One-Day Options Course
- OptionsPro
- Retirement Income Workshop
- Sure-Fire Trading Systems (VectorVest, Inc.)
- Trading as a Business Workshop
- VectorVest 7 EOD
- VectorVest 7 RealTime/IntraDay
- VectorVest AutoTester
- VectorVest Educational Services
- VectorVest OnLine
- VectorVest Options Analyzer
- VectorVest ProGraphics v6.0
- VectorVest ProTrader 7
- VectorVest RealTime Derby Tool
- VectorVest Simulator
- VectorVest Variator
- VectorVest Watchdog