

HOT TOPICS LIST
- MACD
- Fibonacci
- RSI
- Gann
- ADXR
- Stochastics
- Volume
- Triangles
- Futures
- Cycles
- Volatility
- ZIGZAG
- MESA
- Retracement
- Aroon
INDICATORS LIST
LIST OF TOPICS
PRINT THIS ARTICLE
by Mark Rivest
The S&P 500 could reach strong price resistance on an important cycle date.
Position: N/A
Mark Rivest
Independent investment advisor, trader and writer. He has written articles for Technical Analysis of Stocks & Commodities, Traders.com Advantage,Futuresmag.com and, Finance Magnates. Author of website Four Dimension Trading.
PRINT THIS ARTICLE
MARKET TIMING
Stock Market Into The Cross Hair
05/18/17 04:38:03 PMby Mark Rivest
The S&P 500 could reach strong price resistance on an important cycle date.
Position: N/A
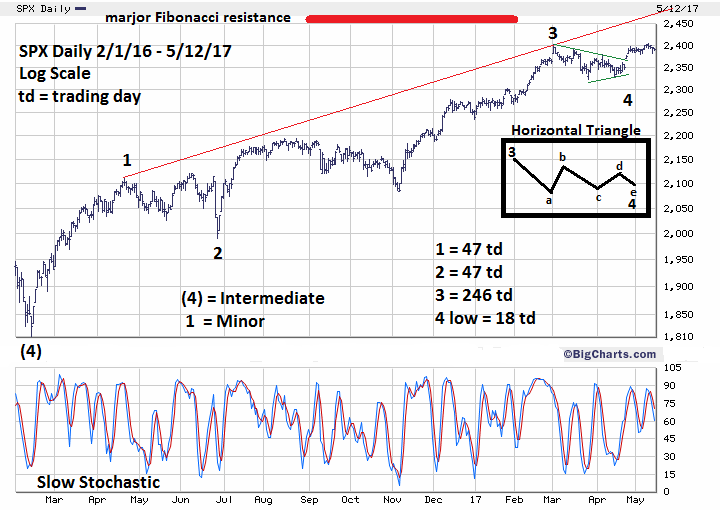
| My last four articles presented the case that a major stock market peak could be made sometime late April 2017 to early June 2017: April 12th article "Termination Date" concerned the Time Dimension; focusing on Fibonacci, Decennial and Seasonal time cycles. April 21st article "Global Non-Confirmation" examined the Momentum Dimension; noted lagging national stock markets and an important US stock sector. May 3rd article "Sentimental Journey" studied the Sentiment Dimension analyzing signals from three stock market sentiment indicators. May 10th article "The Price is Right" viewed the Price Dimension looking at long, intermediate and short term S&P 500 (SPX) Fibonacci price coordinates. Now, an examination of the SPX reaching a very strong price resistance zone ether in a few days or early June. S&P 500 Daily Please see the daily SPX chart illustrated in Figure 1. This is an update to the SPX chart illustrated in my April 12th article using Fibonacci time analysis. There are several methods to Fibonacci time analysis, the April 12th article demonstrated Fibonacci ratios among sub waves from the February 11, 2016 bottom. Minor waves "1" and "2" are equal, each 47 trading days. The combined lengths of "1" and "2" is 94 trading days, multiplied by a Fibonacci 2.618, yields 246 trading days — time length of Minor wave "3". Minor wave "2" multiplied by a Fibonacci .382 equals 18 trading days, which could be the time length of Minor wave "4". The SPX correction low was on March 27th, exactly 18 trading days after the March 1st Minor wave "3" top. However, Minor wave "4" continued forming an Elliott wave Horizontal Triangle. Please see the insert on the SPX chart showing the form of a contracting Horizontal Triangle. In this wave structure, Minor wave "4" doesn't complete until the April 19th sub wave "e" bottom. The SPX Minor wave "4" completion is confirmed by the daily Dow Jones Industrial Average. This indexes Minor wave "4" took the form of an Elliott wave Zigzag which completed with a marginal new low on April 19th. The fascinating aspect of the SPX Horizontal Triangle is that March 1st to April 19th is 34 trading days. "34" is one of the numbers in the Fibonacci sequence and is another method to discover time cycles. The Fibonacci sequence is as follows, (1, 1, 2, 3, 5, 8, 13, 21, 34, 55, 89, to infinity). Perhaps the SPX is now following the path of the Fibonacci sequence instead of Fibonacci ratios? If so it opens the door to another possible time cycle for the completion of Minor wave "5". Adding 21 trading days to the April 19th low targets May 18, 2017 as a possible SPX top. On May 12th, the SPX closed at 2390.90 and could reach major Fibonacci price resistance at 2450-2460. |
|
| Figure 1. On May 12th, the SPX closed at 2390.90 and could reach major Fibonacci price resistance at 2450-2460. |
| Graphic provided by: BigCharts.com. |
| |
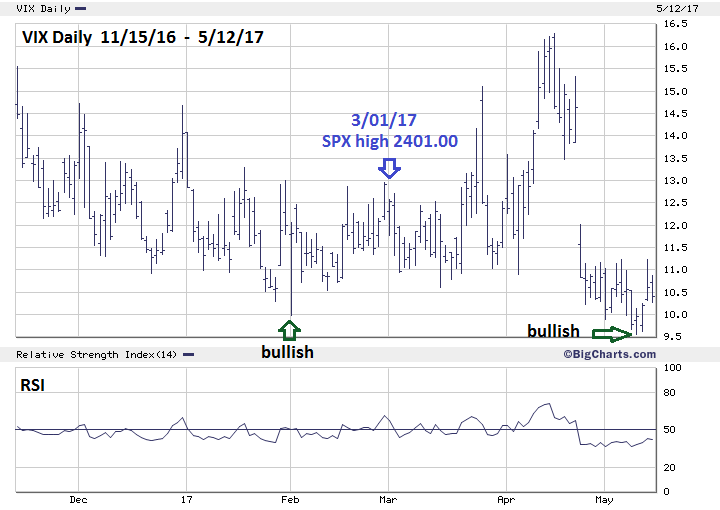
| VIX update The SPX recorded an all-time high of 2403.90 on May 9th, which is just one trading day after a Fibonacci time cycle target. Could this be the termination point of Minor wave "5"? Doubtful, for several reasons. Please see the daily VIX chart illustrated in Figure 2. As mentioned in several of my articles the SPX bull markets almost always terminate with a VIX divergence. My May 3rd article noted that a VIX move below 10.0 would be bullish for the SPX. The SPX high on May 9th was made with the VIX making a new low. This in the near term is the strongest single indicator that the SPX will continue to rise. It would take at least one SPX close above 2403.90 with the VIX closing above its May 9th low for a potential SPX top signal. The SPX decline from 2403.90 is only 9 tenths of a percent. Intraday, the pattern May 9-12 looks like a completed Horizontal Triangle. If so, a post triangle thrust up could begin on May 15th. This possible thrust up ties in exactly with the Fibonacci time cycle top on May 18th. The Nasdaq 100 has been one of the most bullish US stock indexes. On May 12th, it closed only 4.40 points below its May 9th high of 5691.20, and poised to make new all-time high on May 15th. |
|
| Figure 2. It would take at least one SPX close above 2403.90 with the VIX closing above its May 9th low for a potential SPX top signal. |
| Graphic provided by: BigCharts.com. |
| |
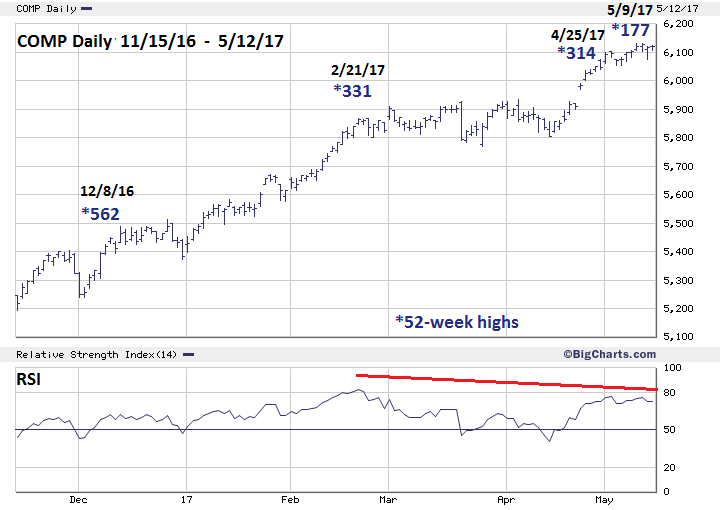
| Nasdaq Composite Daily Please see the daily Nasdaq Composite (COMP) illustrated in Figure 3. COMP's all-time high came with a bearish divergence on the daily RSI and internally has a triple bearish divergence on stocks making new 52-week highs. There were similar divergences in September 2016 and January 2017 which were the prelude to declines of 5.7% and 1.1%. Why should we be concerned about bearish momentum divergences in May 2017? This could be just another false signal or it could be a warning sign of something very bearish developing. The signals in September and January would normally signal the start of an intermediate correction of 10-20% lasting several months. The bull's ability to overcome such signals could be a sign of speculation and complacency. If so, COMP and the other US stock indices could be on the verge of not just an intermediate degree correction, but a major bear market declining more than 20% and lasting several years. More about this in future articles. |
|
| Figure 3. COMP�s all-time high came with a bearish divergence on the daily RSI, and internally has a triple bearish divergence on stocks making new 52-week highs. |
| Graphic provided by: BigCharts.com. |
| |
| Conclusion and Strategy My April 12th article noted four dates as a possible termination point for SPX Minor wave "5"; April 21, May 1, May 8, and June 2. If the SPX does not reach 2450-2460 zone on the new time coordinate of May 18th the next best date for an SPX peak is on or near June 2nd. More about this date in a future article if necessary. Short 50% stocks if the SPX moves above 2420. Use SPX 2510 as a stop loss. We could know very soon if the SPX has crossed into the cross hair of price and time. Further Reading: Frost A.J and Robert Prechter (1985) "Elliott Wave Principle", New Classics Library. |
Independent investment advisor, trader and writer. He has written articles for Technical Analysis of Stocks & Commodities, Traders.com Advantage,Futuresmag.com and, Finance Magnates. Author of website Four Dimension Trading.
| Website: | www.fourdimensiontrading.com |
| E-mail address: | markrivest@gmail.com |
Click here for more information about our publications!
Comments
Date:�05/18/17Rank:�5Comment:�

Request Information From Our Sponsors
- StockCharts.com, Inc.
- Candle Patterns
- Candlestick Charting Explained
- Intermarket Technical Analysis
- John Murphy on Chart Analysis
- John Murphy's Chart Pattern Recognition
- John Murphy's Market Message
- MurphyExplainsMarketAnalysis-Intermarket Analysis
- MurphyExplainsMarketAnalysis-Visual Analysis
- StockCharts.com
- Technical Analysis of the Financial Markets
- The Visual Investor
- VectorVest, Inc.
- Executive Premier Workshop
- One-Day Options Course
- OptionsPro
- Retirement Income Workshop
- Sure-Fire Trading Systems (VectorVest, Inc.)
- Trading as a Business Workshop
- VectorVest 7 EOD
- VectorVest 7 RealTime/IntraDay
- VectorVest AutoTester
- VectorVest Educational Services
- VectorVest OnLine
- VectorVest Options Analyzer
- VectorVest ProGraphics v6.0
- VectorVest ProTrader 7
- VectorVest RealTime Derby Tool
- VectorVest Simulator
- VectorVest Variator
- VectorVest Watchdog