

HOT TOPICS LIST
- MACD
- Fibonacci
- RSI
- Gann
- ADXR
- Stochastics
- Volume
- Triangles
- Futures
- Cycles
- Volatility
- ZIGZAG
- MESA
- Retracement
- Aroon
INDICATORS LIST
LIST OF TOPICS
PRINT THIS ARTICLE
by Mark Rivest
See why lagging national stock markets could be the prelude to a major bear market.
Position: N/A
Mark Rivest
Independent investment advisor, trader and writer. He has written articles for Technical Analysis of Stocks & Commodities, Traders.com Advantage,Futuresmag.com and, Finance Magnates. Author of website Four Dimension Trading.
PRINT THIS ARTICLE
MOMENTUM
Global Non-Conformation
04/21/17 05:33:06 PMby Mark Rivest
See why lagging national stock markets could be the prelude to a major bear market.
Position: N/A
| Economic recoveries and stock bull markets develop in three phases. The first phase is survival, as most investors believe the move off a major bottom is just temporary. The rally is an opportunity to sell losing stocks or to preserve gains in winning positions. The second phase is recognition, where signs appear that the economic recovery is sustainable. Investors reduce selling and increase new purchases; most stocks make new highs. The third phase is speculation, where the clear majority of investors know that a bull market is underway -- greater risks are taken as complacency sets in. The economy continues to improve, but at a reduced rate. Most stocks continue to rally, but less are making new highs. This phenomenon was recognized by "Dow Theorists" over a hundred years ago, and one of the major aspects of Dow Theory is market divergences. Then, there were only two US stock indices, Dow Industrials and Dow Rails, now called Dow Transports. A divergence of one index to the other signaled coming weakness in the economy and a bear market. The same concept can be used to compare world stock markets. From the bottoms made in late 2008 and early 2009 to 2015 most of the world's stock indices were making new highs. Since 2015 there have been divergences. Asia Below is a sample of Asian stock markets.
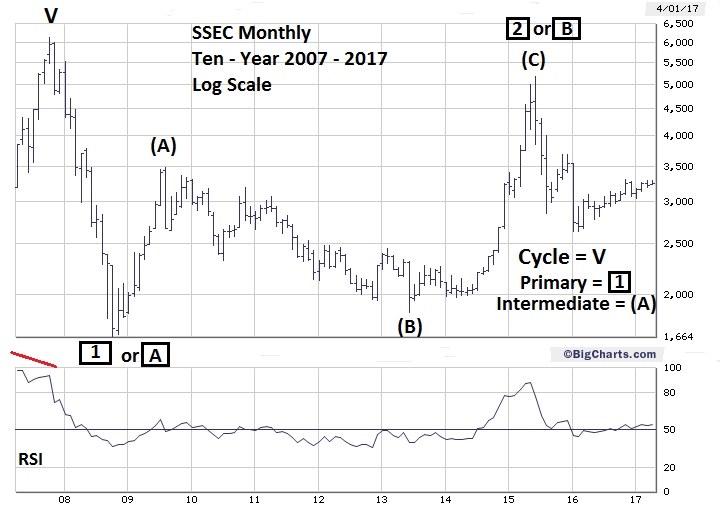
Of this sample, none have exceeded their all-time highs. Only the Australia - All has exceeded its 2015 high, with India-Sensex marginally below its 2015 high and South Korea KOSPI 2% below its all-time high made in 2011. The most bearish signals are from Japan, the world's third largest economy, and China, the second largest economy. Japan - Nikkei 225 peaked in 1990 then had a mind boggling 19-year bear market. As of April 13, 2017, Nikkei 225 is 12% below its 2015 high. Please see the monthly Shanghai Composite (SSEC) chart illustrated in Figure 1. Despite a 23% rally from the bottom made in early 2016, the SSEC as of April 13, 2017 is still an incredible 37% below its 2015 peak. This is a very bearish signal of China's economic strength. | |||||||||||||||||||||||||||
| |||||||||||||||||||||||||||
| Figure 1. Despite a 23% rally from the bottom made in early 2016 the SSEC, as of April 13, 2017, is still an incredible 37% below its 2015 peak. | |||||||||||||||||||||||||||
| Graphic provided by: BigCharts.com. | |||||||||||||||||||||||||||
| | |||||||||||||||||||||||||||
| Europe and Africa Below is a sample of European stock markets and one from Africa.
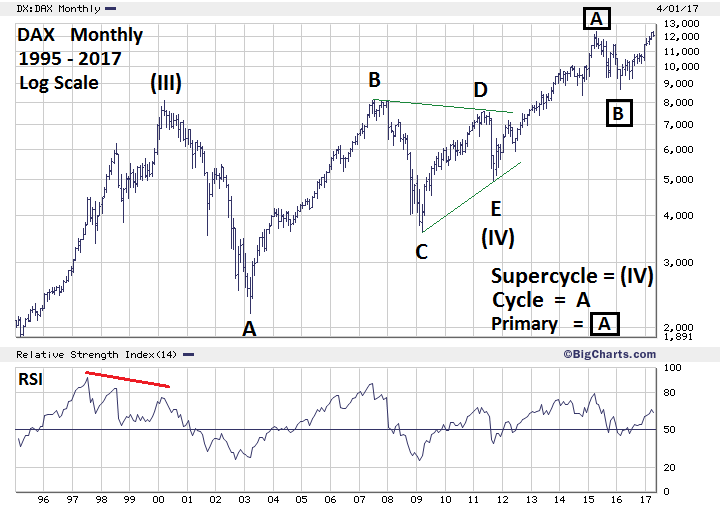
Half of the indices in this sample have made all-time highs, with the DAX as of April 13, 2017 only marginally below its 2015 high. The condition of the other three indices is much more bearish. France's main stock index, CAC-40, peaked in 2000, subsequently had a lower high in 2007, then made another lower peak in 2015. As of April 13, 2017, the CAC-40 is still below its 2015 top. Italy and Spain's main stock indices subsequently went below their 2009 lows and as of April 13,2017 are both still below their late 2009 highs. Please see the Monthly DAX chart illustrated in Figure 2. Germany has the world's fourth largest economy and the DAX appears to be on the verge of an all-time high. If it does marginally exceed its 2015 peak it could have a similar result to what happened in 2007 when the DAX marginally exceeded the high made in 2000. An all-time high in the DAX may correspond with a possible major S&P 500 peak in May 2017. Please see my April 12th article, "Termination Date". | |||||||||||||||||||||||||||
| |||||||||||||||||||||||||||
| Figure 2. An all-time high in the DAX may correspond with a possible major S&P 500 peak in May 2017. | |||||||||||||||||||||||||||
| Graphic provided by: BigCharts.com. | |||||||||||||||||||||||||||
| | |||||||||||||||||||||||||||
| The Americas Below is a sample of North and South American stock markets.
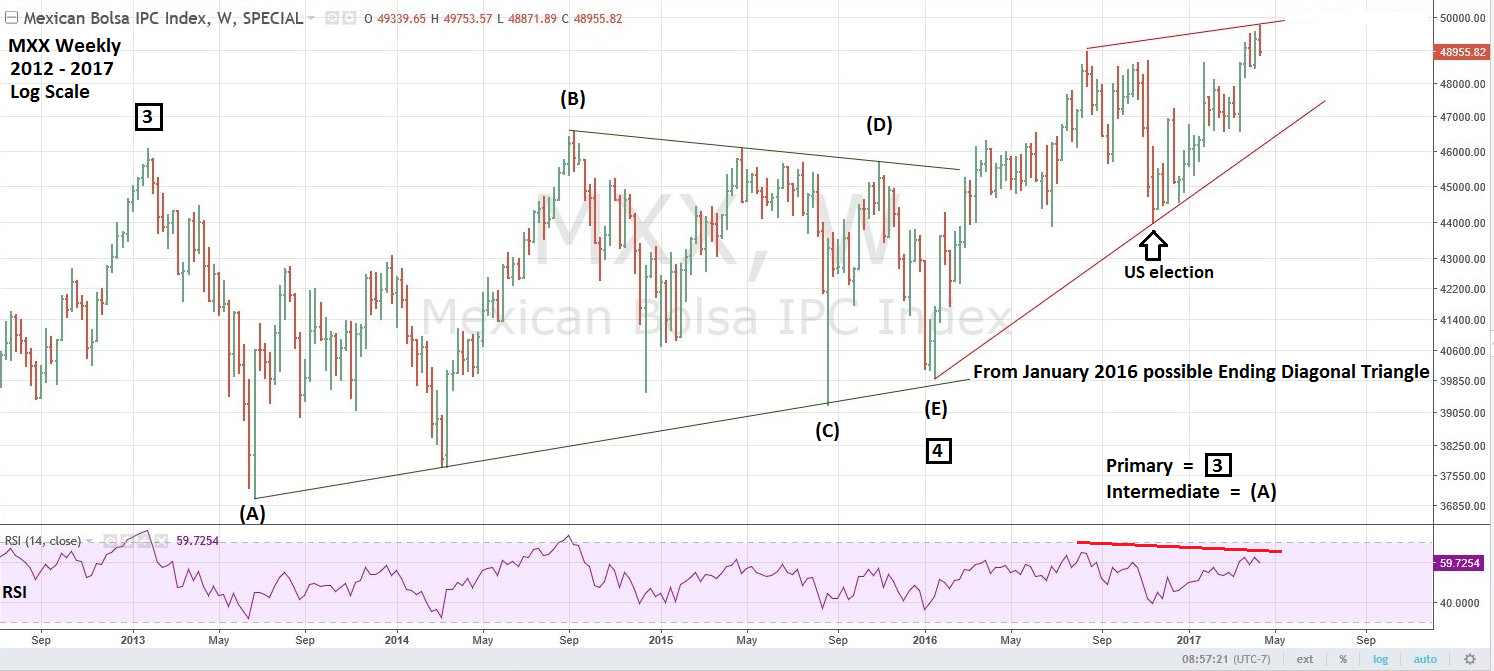
The America's have the most bullish stock indices with only one laggard among the five largest economies in the hemisphere. Please see the Weekly Mexico - IPC (MXX) chart illustrated in figure 3. This chart is an update to one illustrated in my March 9, 2016 article "Mexico, the Secret Bull Market Indicator". This article noted that the sideways move of the MXX was an Elliott wave Horizontal Triangle and forecasted an MXX new all-time high. Subsequently, this is what happened, and the rally from the early 2016 bottom could be taking the shape of an Ending Diagonal Triangle. If so, this could prove to be an aid to catching a possible major global stock market peak. | |||||||||||||||||||||||||||
| |||||||||||||||||||||||||||
| Figure 3. The rally from the early 2016 bottom could be taking the shape of an Ending Diagonal Triangle. | |||||||||||||||||||||||||||
| Graphic provided by: Tradingview.com. | |||||||||||||||||||||||||||
| | |||||||||||||||||||||||||||
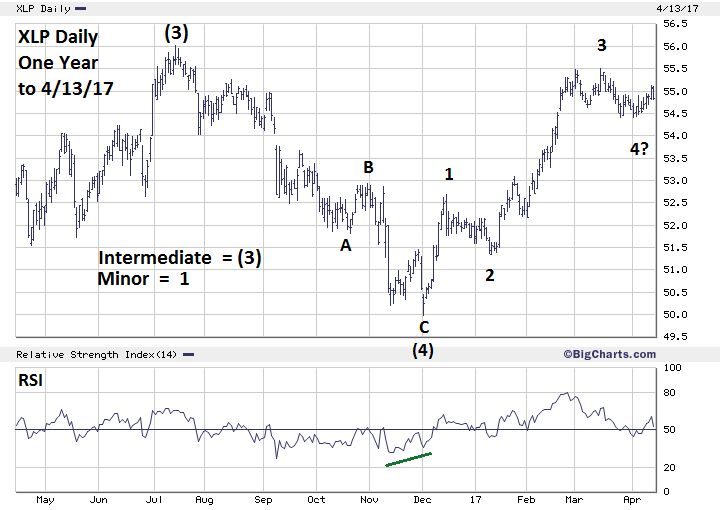
| Consumer Staples Select SPDR Fund (XLP) Please see the Daily XLP chart illustrated in Figure 4. The stocks in XLP are consumer staples, normally the last sector to peak in a bull market, yet in late 2016 XLP was significantly lagging the broader US stock market. My December 14th article "Bull Run" noted the XLP had finally exhibited evidence of at least a short-term bottom. Since then XLP has rallied — yet is still as of April 13, 2017 below its July 2016 peak. The move up from the December bottom appears to be forming a text book Elliott five-wave pattern. If so, the high made in July 2016 could be breached in the next few weeks. If a new high is made it could be the termination point of not only the rally from December 2016, but also the termination point of the broader bull market from 2009. | |||||||||||||||||||||||||||
| |||||||||||||||||||||||||||
| Figure 4. The move up from the December bottom appears to be forming a text book Elliott five-wave pattern. | |||||||||||||||||||||||||||
| Graphic provided by: BigCharts.com. | |||||||||||||||||||||||||||
| | |||||||||||||||||||||||||||
| Summary Bearish divergences among stock indices are easy to recognize and require no special knowledge. The hard part — they appear in the speculative phase of stock bull markets. The divergences could continue for months creating false tops before the final frenzied bull buys into the rally. History has shown that eventually these bearish divergences are the prelude to deep stock market declines. When the next deep stock market decline occurs, the bulls that have ignored the bearish divergences will have their own word for the new declining phase — that word is pain. Further Reading: Frost A.J and Robert Prechter (1985) "Elliott Wave Principle", New Classics Library. |
Independent investment advisor, trader and writer. He has written articles for Technical Analysis of Stocks & Commodities, Traders.com Advantage,Futuresmag.com and, Finance Magnates. Author of website Four Dimension Trading.
| Website: | www.fourdimensiontrading.com |
| E-mail address: | markrivest@gmail.com |
Click here for more information about our publications!
Comments

Request Information From Our Sponsors
- StockCharts.com, Inc.
- Candle Patterns
- Candlestick Charting Explained
- Intermarket Technical Analysis
- John Murphy on Chart Analysis
- John Murphy's Chart Pattern Recognition
- John Murphy's Market Message
- MurphyExplainsMarketAnalysis-Intermarket Analysis
- MurphyExplainsMarketAnalysis-Visual Analysis
- StockCharts.com
- Technical Analysis of the Financial Markets
- The Visual Investor
- VectorVest, Inc.
- Executive Premier Workshop
- One-Day Options Course
- OptionsPro
- Retirement Income Workshop
- Sure-Fire Trading Systems (VectorVest, Inc.)
- Trading as a Business Workshop
- VectorVest 7 EOD
- VectorVest 7 RealTime/IntraDay
- VectorVest AutoTester
- VectorVest Educational Services
- VectorVest OnLine
- VectorVest Options Analyzer
- VectorVest ProGraphics v6.0
- VectorVest ProTrader 7
- VectorVest RealTime Derby Tool
- VectorVest Simulator
- VectorVest Variator
- VectorVest Watchdog