

HOT TOPICS LIST
- MACD
- Fibonacci
- RSI
- Gann
- ADXR
- Stochastics
- Volume
- Triangles
- Futures
- Cycles
- Volatility
- ZIGZAG
- MESA
- Retracement
- Aroon
INDICATORS LIST
LIST OF TOPICS
PRINT THIS ARTICLE
by Mark Rivest
Important levels to watch if the stock market uptrend is to continue.
Position: N/A
Mark Rivest
Independent investment advisor, trader and writer. He has written articles for Technical Analysis of Stocks & Commodities, Traders.com Advantage,Futuresmag.com and, Finance Magnates. Author of website Four Dimension Trading.
PRINT THIS ARTICLE
MOMENTUM
Bull Run
12/14/16 03:17:05 PMby Mark Rivest
Important levels to watch if the stock market uptrend is to continue.
Position: N/A
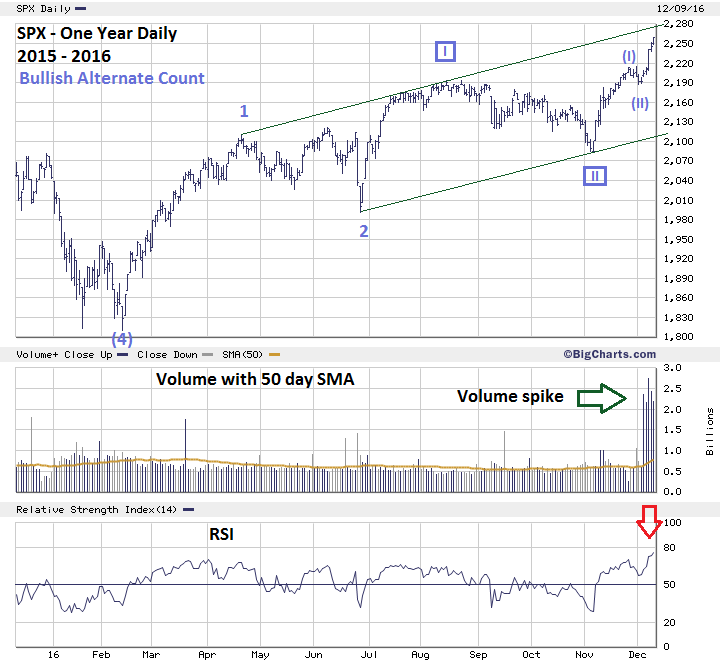
| December 5th to the 9th was a historic week for the US stock market and not just because of the surge up in prices. As of December 9, 2016, the US stock market is either near an intermediate top or in the middle of a bull run that could last for several weeks. Levels on the S&P 500 (SPX) hold clues as to which direction the US stock market could take in the next two months. S&P 500 — One Year Please see the SPX — One Year chart illustrated in Figure 1. For every bullish Elliott wave count, there is always an alternate bearish count. In complex market movements, there are multiple ways to interpret patterns. There could perhaps be two bullish counts and three bearish counts. The most bullish possible wave count from the February bottom is shown in the one year chart. This shows the SPX in what could be a third of a third wave to the upside. This is very bullish and implies a steady move up in the SPX that could take the index well above 2300 and last until early February. If this wave count is wrong where could the SPX find resistance? The SPX May 2015 peak was 2134.70 and the February 2016 bottom was 1810.10, so the difference is 324.60 multiplied by 1.382 equals 448.60 added to 1810.10 targets 2258.70. Using the same technique on a shorter time scale yields an interesting target. The August 2016 SPX peak was 2193.80 and the November 2015 bottom was 2083.80, so the difference 110.00 multiplied by 1.618 equals 178.00 added to 2083.80 targets 2261.80. Two very close Fibonacci coordinates at 2258.70 and 2261.80 represent powerful resistance. The SPX high on December 9, 2016 was 2259.80. The trading week ending December 9th had historic volume. Both the SPX and the Dow Jones Industrial Average (DJIA) recorded volume levels that were over 200% above their respective 50-day Simple Moving Averages (SMA). The upside volume spike is the largest since March of 2009, the start of the secular bull market. On the surface this supports the case that the SPX is in the third of a third to the upside which is exactly where you should see a volume spike. However, there were no volume spikes on the two Exchange Traded Funds (ETF) that track the DJIA and the SPX. The SPDR Dow Jones Industrial Average ETF (DIA) had volume that was only about 60% above its 50-day SMA. The SPDR S&P 500 ETF (SPY) had volume that was around its 50-day SMA. The daily RSI on December 9th reached 76.1%. This is the highest reading since the January 14, 2011 mark of 76.7%. Most of the time, stocks and stock indices will reach peaks on an RSI bearish divergence. This implies near term that the SPX could decline, then make a higher high with a lower RSI reading. The weekly SPX RSI is showing a tiny bearish divergence with the reading made at the August 2016 top. The monthly SPX RSI is showing a significant bearish divergence with the peak made in 2015. |
|
| Figure 1. Two very close Fibonacci coordinates at 2258.70 and 2261.80 represent powerful resistance. |
| Graphic provided by: BigCharts.com. |
| |
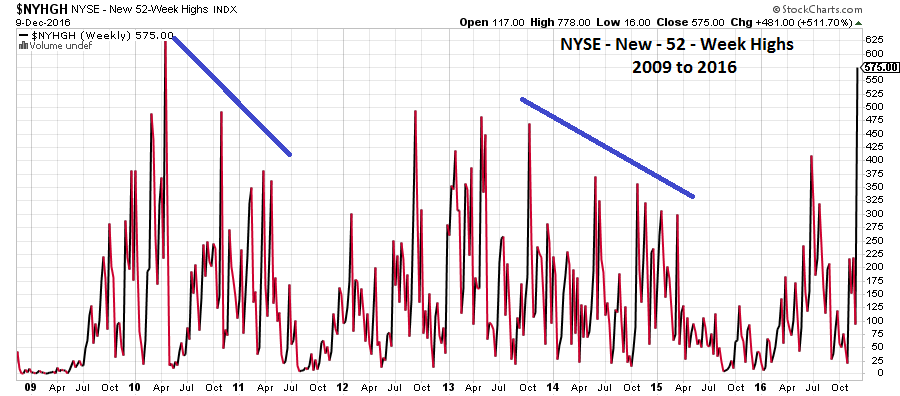
| NYSE — New-52 Week Highs December 9th marked a historic week for new NYSE stock highs. Please see the NYSE — New-52 Week Highs chart illustrated in Figure 2. The NYSE &mdashl; New-52 Week Highs are at the highest level since the week of April 19th 2010. Usually after new 52-week highs reach an extreme, the SPX will make an intermediate top, have a decline, then make a higher top as the NYSE new highs make lower peaks. Note the declining peaks on the chart. The week after April 19th, 2010, the SPX made an intermediate peak followed by a 17.1% two-month decline. |
|
| Figure 2. The week after April 19th, 2010, the SPX made an intermediate peak followed by a 17.1% two-month decline. |
| Graphic provided by: StockCharts.com. |
| |
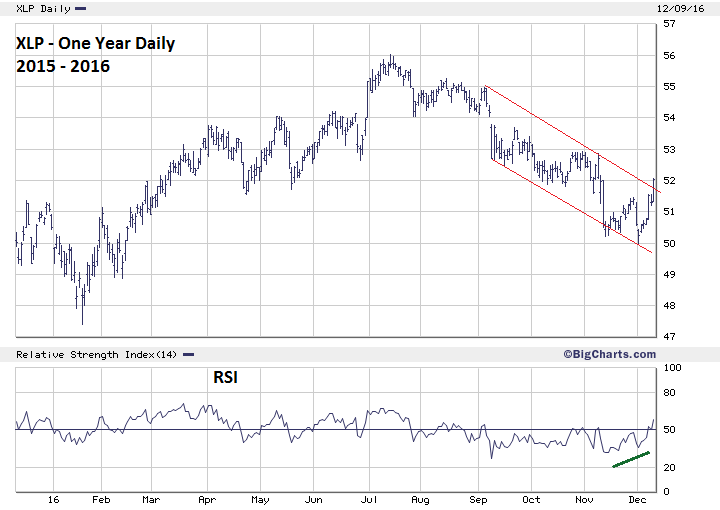
| Sector Analysis SPDR funds has nine sector ETFs. During the powerful bull run from the November 3rd bottom, three sectors have failed to participate. The three lagging sectors are: Utilities (XLU), Health Care (XLV), and Consumer Staples (XLP). In a stock market third of a third up, you should see all nine sectors participating and near their respective 52-week highs. It's very suspicious that three sectors, as of December 9th, are languishing near their correction bottoms. Please see the XLP — One Year Daily chart illustrated in Figure 3. The XLP has finally exhibited evidence of at least a short term bottom with an RSI bullish divergence and a marginal break out above the declining upper trend line. Bullish stock market analysts are saying the rally will soon broaden out to other sectors. If so, XLP should continue its rise. Keep watch on XLP. |
|
| Figure 3. The XLP has finally exhibited evidence of at least a short-term bottom. |
| Graphic provided by: BigCharts.com. |
| |
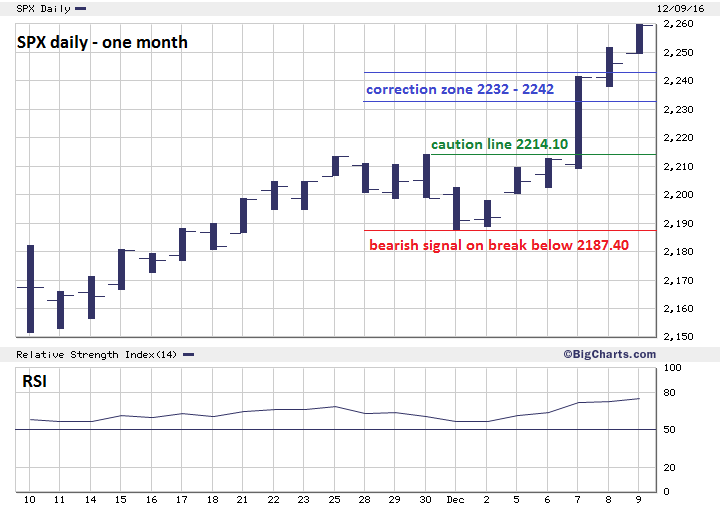
| S&P 500 — One Month Please see the SPX — One Month chart illustrated in Figure 4. These are the various scenarios and levels to watch for in the next few weeks: 1) The SPX keeps going up, pushing beyond the Fibonacci resistance zone and the upper rising trend line. The steady rally could continue into early February, stopping well above SPX 2300. 2) The SPX has resistance at the Fibonacci cluster 2258-2261. Powerful up moves usually have shallow corrections, look for a possible bottom in the SPX 2232-2242 area. 3) The SPX declines below a .618 retrace of the rally from December 1st and overlaps the November 30th high of 2214.10. This would be a clue that something more bearish could be developing. 4) The SPX breaks below the bottom at 2187.40. This would significantly lower the probabilities that a powerful third of a third wave up is under development and opens the door to a move down to at least SPX 2050. |
|
| Figure 4. Powerful up moves usually have shallow corrections. Look for a possible bottom in the SPX 2232�2242 area. |
| Graphic provided by: BigCharts.com. |
| |
| Strategy and Summary My last article "A Tale of Two Stock Markets" recommended a 50% short position with a stop at SPX 2235 which was hit. Stand aside — the US Stock market as of December 9th, is at the precipice of either a multi-week move up or a multi-week move down. There could be clues to the direction as soon as the week of December 12-16. The bulls have the burden of proof. If the bull run is to continue the SPX should quickly breach the Fibonacci and trend line resistance. If not, there could be another historical week lurking out there. Perhaps a historical week to the downside. Further Reading: Frost A.J and Robert Prechter (1985) "Elliott Wave Principle", New Classics Library. |
Independent investment advisor, trader and writer. He has written articles for Technical Analysis of Stocks & Commodities, Traders.com Advantage,Futuresmag.com and, Finance Magnates. Author of website Four Dimension Trading.
| Website: | www.fourdimensiontrading.com |
| E-mail address: | markrivest@gmail.com |
Click here for more information about our publications!
Comments
Date:�12/14/16Rank:�5Comment:�
Date:�12/16/16Rank:�2Comment:�

Request Information From Our Sponsors
- StockCharts.com, Inc.
- Candle Patterns
- Candlestick Charting Explained
- Intermarket Technical Analysis
- John Murphy on Chart Analysis
- John Murphy's Chart Pattern Recognition
- John Murphy's Market Message
- MurphyExplainsMarketAnalysis-Intermarket Analysis
- MurphyExplainsMarketAnalysis-Visual Analysis
- StockCharts.com
- Technical Analysis of the Financial Markets
- The Visual Investor
- VectorVest, Inc.
- Executive Premier Workshop
- One-Day Options Course
- OptionsPro
- Retirement Income Workshop
- Sure-Fire Trading Systems (VectorVest, Inc.)
- Trading as a Business Workshop
- VectorVest 7 EOD
- VectorVest 7 RealTime/IntraDay
- VectorVest AutoTester
- VectorVest Educational Services
- VectorVest OnLine
- VectorVest Options Analyzer
- VectorVest ProGraphics v6.0
- VectorVest ProTrader 7
- VectorVest RealTime Derby Tool
- VectorVest Simulator
- VectorVest Variator
- VectorVest Watchdog