HOT TOPICS LIST
- MACD
- Fibonacci
- RSI
- Gann
- ADXR
- Stochastics
- Volume
- Triangles
- Futures
- Cycles
- Volatility
- ZIGZAG
- MESA
- Retracement
- Aroon
INDICATORS LIST
LIST OF TOPICS
PRINT THIS ARTICLE
by Mark Rivest
How to trade a stock market moving in two directions at the same time.
Position: Sell
Mark Rivest
Independent investment advisor, trader and writer. He has written articles for Technical Analysis of Stocks & Commodities, Traders.com Advantage,Futuresmag.com and, Finance Magnates. Author of website Four Dimension Trading.
PRINT THIS ARTICLE
MOMENTUM
A Tale of Two Stock Markets
12/07/16 10:28:24 AMby Mark Rivest
How to trade a stock market moving in two directions at the same time.
Position: Sell
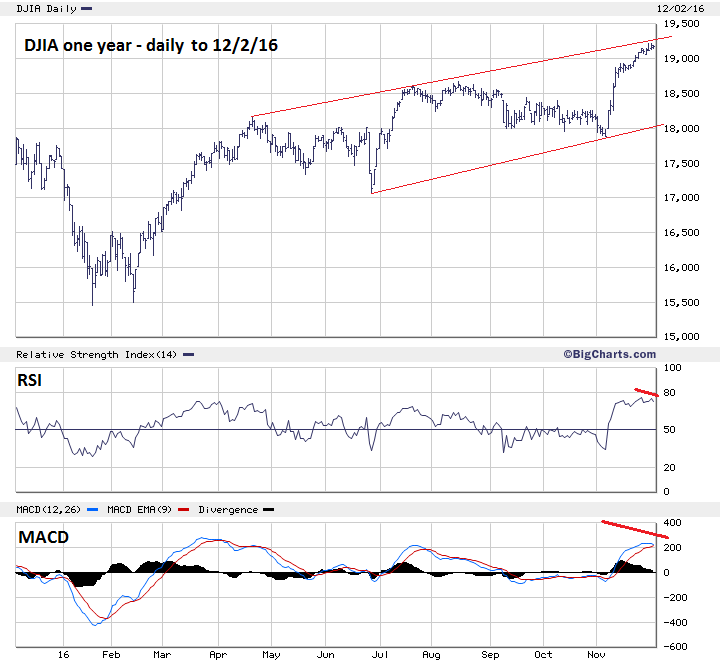
| It's been the best of times holding long — financial and industrial stocks. Since November 3rd, Financial Select Sector SPDR fund (XLF) is up 15.8% and Industrial Select Sector SPDR fund (XLI) is up 11.6%. It's been the worst of times holding long — utility and consumer staple stocks. Since November 3rd, Utility Select Sector SPDR fund (XLU) is down 2.7%, down 11.6% from July 6th and Consumer Staples Sector SPDR fund (XLP) is down 2.8%, down 9.2% from July 15th. How long can this split market condition last? Technical analysis has some table pounding clues. Dow Jones Industrial Average Some analysts are saying a split stock market is good, that this is healthy sector rotation. Is a split stock market healthy for the longer term bullish trend? Let's examine the industrials, one of the strongest sectors. Please see the daily Dow Jones Industrial Average (DJIA) chart illustrated in Figure 1. The DJIA, as of the close on December 2nd, was very close to hitting the rising trend line connecting the April and June peaks. Additionally, the RSI has a minor bearish divergence and the MACD histogram is bearish with the lines about to roll over. Very short term the DJIA intraday pattern from its 2016 high made on November 30th looks corrective. If the DJIA moves to a new all-time during the week of December 5-9, it's possible either the S&P 500 (SPX) or the Nasdaq Composite (COMP) could fail to confirm the new high. If so, it would be additional bearish evidence. Regardless if whether a new high is made, the DJIA is poised for a decline that could take it back down to at least the bottom made on November 3rd. |

|
| Figure 1. Whether or not a new high is made, the DJIA is poised for a decline that could take it back down to at least the bottom made on November 3rd. |
| Graphic provided by: BigCharts.com. |
| |
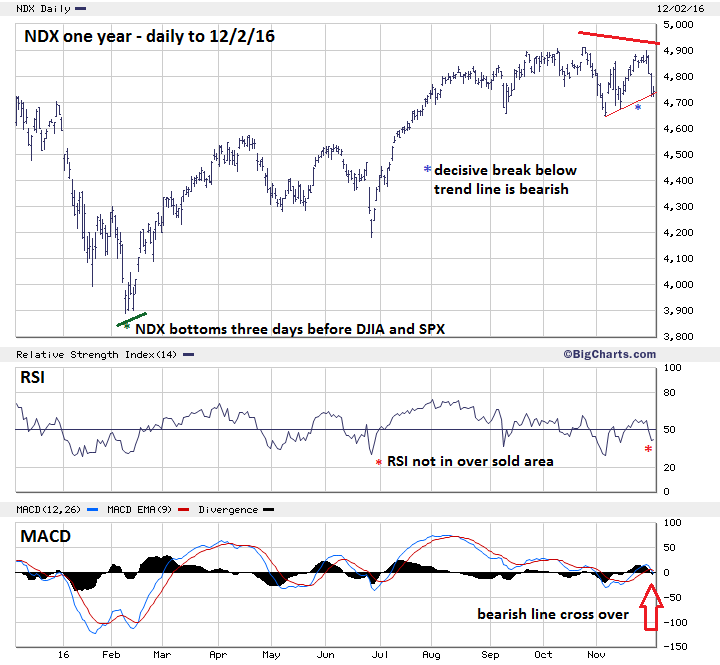
| Nasdaq 100 Please see the daily Nasdaq 100 (NDX) chart illustrated in Figure 2. Since the Brexit bottom made on June 27th, the NDX had been the leader and one of the strongest US stock indexes. The SPX and DJIA had intermediate tops made on August 15th and COMP topped on September 22nd, but NDX did not peak until October 25th. Since then, NDX has underperformed all three main US stock indices which have since made new highs unconfirmed by the NDX. The last time NDX failed to confirm the three main US stock indices was back in February at the last significant bottom. The MACD lines have a bearish crossover. The RSI is still not yet in the oversold zone and the NDX has retraced 63% of its rally from November 4th. You could make a case that the NDX is still the leader — except now its leading the way down. |

|
| Figure 2. You could make a case that the NDX is still the leader — except now its leading the way down. |
| Graphic provided by: BigCharts.com. |
| |
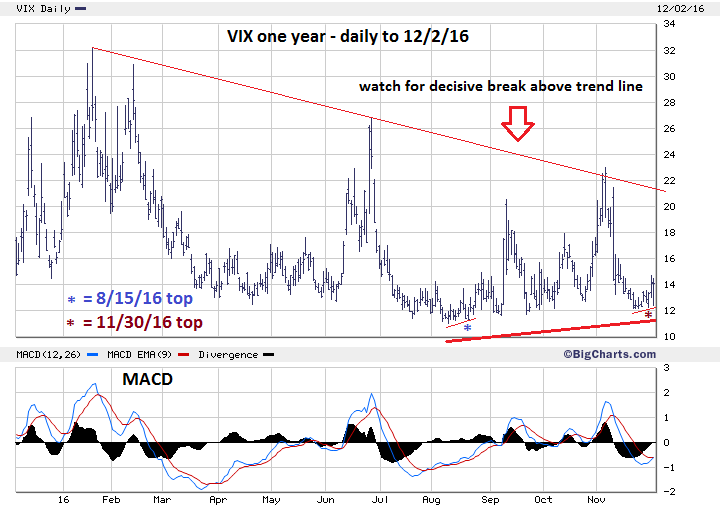
| VIX Please see the daily VIX chart illustrated in Figure 3. The VIX is a great tool to measure sentiment of the SPX. Sharp spikes up occur near SPX bottoms. Catching SPX tops is another matter, as VIX lows rarely correspond with SPX tops. Almost always at least one bottom divergence is required on the VIX before the SPX records a top. Note the divergence that occurred at the SPX August 15th peak and the divergence that occurred at the SPX November 30th top. There is also a broader divergence of the November rally vs. the August rally. It's possible that if the SPX were to make another new all-time high a double divergence could be recorded. If the VIX made a new low it would be a bullish SPX signal. |

|
| Figure 3. Almost always at least one bottom divergence is required on the VIX before the SPX records a top. |
| Graphic provided by: BigCharts.com. |
| |
| Summary and Strategy When the stock market makes a significant bottom, such as what happened in February 2016, nearly all sectors participate in the subsequent bullish move. The broad participation of stocks rallying will usually last until into at least two thirds of the bull move. It is in the later stages of a bull market when sector divergences occur. Belief that the current so called sector rotation is healthy for the continuing uptrend in stocks is wrong. When a leading sector is exhibiting bearish momentum divergences it's not healthy for the continuing uptrend. When the prior leading stock index on the upside is now leading on the downside it's not healthy for the continuing uptrend. When the VIX fails to make a new low while the SPX is making a new high it's not healthy for the continuing uptrend. There is a very high probability that the US stock market is very close to at least an intermediate top and that the rallies of the SPX, DJIA, and COMP from November 3rd will be completely retraced. My last article "Blow Off Top" recommended a 50% short position on stocks with a stop loss at SPX 2235. Maintain this strategy. Focus on market evidence instead of market myths, this will keep you in the season of light and out of the season of darkness. |
Independent investment advisor, trader and writer. He has written articles for Technical Analysis of Stocks & Commodities, Traders.com Advantage,Futuresmag.com and, Finance Magnates. Author of website Four Dimension Trading.
| Website: | www.fourdimensiontrading.com |
| E-mail address: | markrivest@gmail.com |
Click here for more information about our publications!
Comments
Date: 12/08/16Rank: 1Comment: It seems like you have been trying to short this market for the several months. I subscribe to S C to learn. Any casual trader would have liked to have been in a 10%+ rally in financials or industrial. Then get out. I would like to something on that and how we could have identified the sector rotation early enough.

|

Request Information From Our Sponsors
- StockCharts.com, Inc.
- Candle Patterns
- Candlestick Charting Explained
- Intermarket Technical Analysis
- John Murphy on Chart Analysis
- John Murphy's Chart Pattern Recognition
- John Murphy's Market Message
- MurphyExplainsMarketAnalysis-Intermarket Analysis
- MurphyExplainsMarketAnalysis-Visual Analysis
- StockCharts.com
- Technical Analysis of the Financial Markets
- The Visual Investor
- VectorVest, Inc.
- Executive Premier Workshop
- One-Day Options Course
- OptionsPro
- Retirement Income Workshop
- Sure-Fire Trading Systems (VectorVest, Inc.)
- Trading as a Business Workshop
- VectorVest 7 EOD
- VectorVest 7 RealTime/IntraDay
- VectorVest AutoTester
- VectorVest Educational Services
- VectorVest OnLine
- VectorVest Options Analyzer
- VectorVest ProGraphics v6.0
- VectorVest ProTrader 7
- VectorVest RealTime Derby Tool
- VectorVest Simulator
- VectorVest Variator
- VectorVest Watchdog
