HOT TOPICS LIST
- MACD
- Fibonacci
- RSI
- Gann
- ADXR
- Stochastics
- Volume
- Triangles
- Futures
- Cycles
- Volatility
- ZIGZAG
- MESA
- Retracement
- Aroon
INDICATORS LIST
LIST OF TOPICS
PRINT THIS ARTICLE
by Mark Rivest
Rare stock market spike up presents rare profit opportunity.
Position: N/A
Mark Rivest
Independent investment advisor, trader and writer. He has written articles for Technical Analysis of Stocks & Commodities, Traders.com Advantage,Futuresmag.com and, Finance Magnates. Author of website Four Dimension Trading.
PRINT THIS ARTICLE
MOMENTUM
Blow Off Top
11/30/16 04:20:36 PMby Mark Rivest
Rare stock market spike up presents rare profit opportunity.
Position: N/A
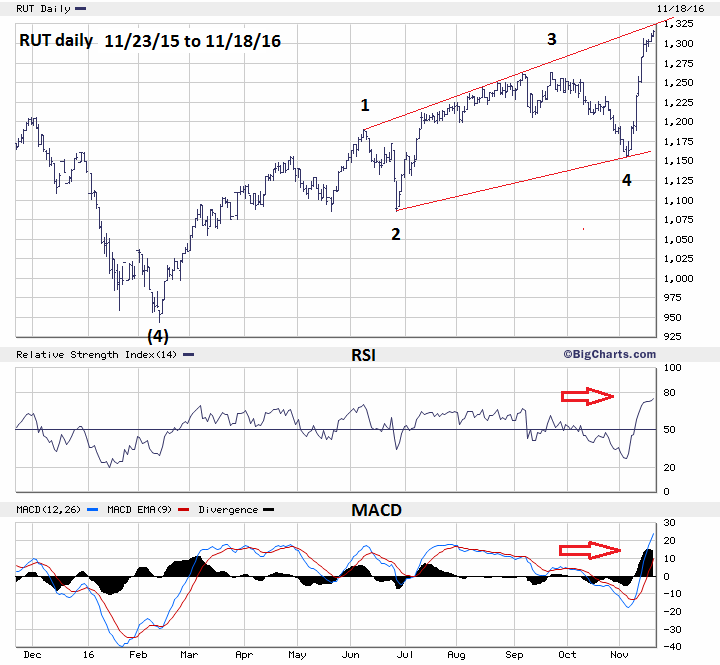
| On November 18, 2016, the Russell 2000 (RUT) closed at an all-time high with the three main US stock indices only slightly below their post-election rally peaks. On the surface, it would appear insane to attempt to short the steep rally, clues underneath the surface reveal a top could come soon. The next decline could quickly retrace most, or all, the post-election rally. Daily Russell 2000 Since November 4th the RUT has been the most relentless US stock index, up eleven consecutive days. Please see the daily RUT chart illustrated in Figure 1. Since the February bottom, RUT could be forming an Elliott wave Ending Diagonal Triangle (EDT). One flaw with this theory is that the trend lines are diverging. Almost all EDT's have converging trend lines. Also, all sub-waves of an EDT need to sub-divide into three waves. From the November 3rd bottom the supposed wave "5" has not sub-divided, implying a decline of at least one or two days before a final rally to a new high. In Elliott wave theory, within a five-wave impulse pattern, wave "3" of the sub waves (1,3, and,5) can never be the shortest. The RUT June-September rally is shorter than the February-June rally. The June-September rally was 177.577 points added to the November 3rd bottom targets RUT 1333.662 — a move above this level will invalidate the EDT pattern and is bullish. If the rising trend line from the June peak crosses the area of RUT 1321-1325 a possible topping zone could be reached. Additionally, both the daily RSI and MACD are in the overbought area indicating the rally could be nearing completion. |

|
| Figure 1. If the rising trend line from the June peak crosses the area of RUT 1321-1325 a possible topping zone could be reached. |
| Graphic provided by: BigCharts.com. |
| |
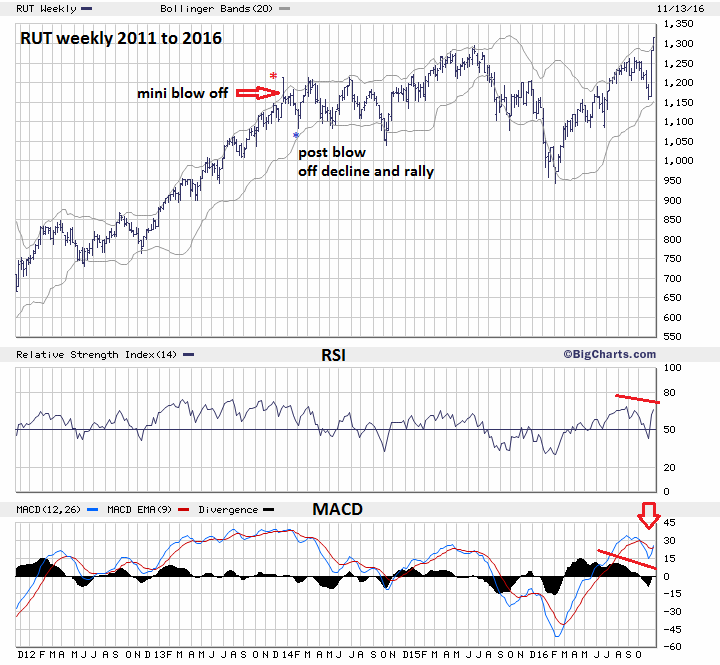
| Weekly Russell 2000 Please see the weekly RUT chart illustrated in Figure 2. Note the RUT has broken above the weekly upper Bollinger Band which frequently indicates being near, or at, a peak. Now notice the rally top made in the first week of March 2014. This rally which lasted almost a month is a mini blow off top and could be a preview of coming attractions for late 2016 and early 2017. After the early March 2014 top the subsequent decline erased all the gains made in the blow off rally. From the May 15, 2014 bottom the RUT rallied back to the blow off top. In my last article "Blow Off Top or Kick Off Rally" I noted that seasonality is bullish. Perhaps in the next two-three months RUT could have a repeat of March-June 2014. Weekly momentum indicators are mixed. The RSI is showing a bearish divergence on the August top with no divergence on the September peak. Longer term, the RSI is above the level it recorded at the June 2015 top. The MACD histogram is bearish while the weekly line just had a bullish cross over. These mixed signals imply that if there is a near term price peak, a higher top could develop several weeks later. |

|
| Figure 2. Note the RUT has broken above the weekly upper Bollinger Band which frequently indicates being near, or at, a peak. |
| Graphic provided by: BigCharts.com. |
| |
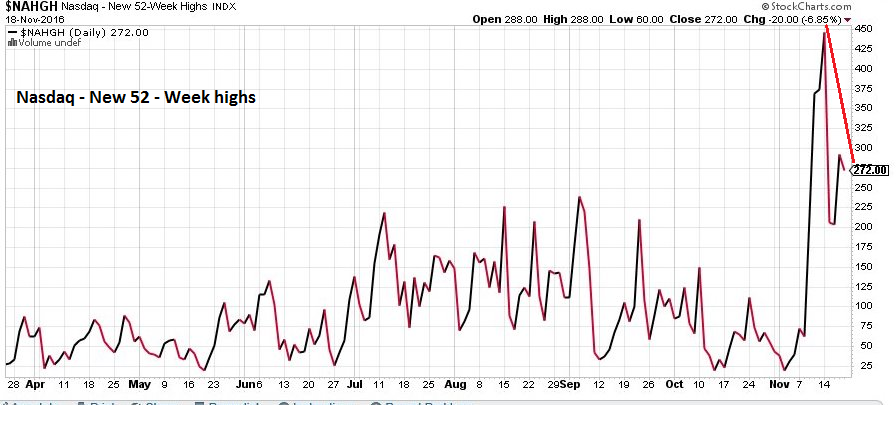
| Nasdaq — New 52-Week Highs Please see the daily Nasdaq — New 52-Week highs chart illustrated in Figure 3. With small cap stocks leading the way up we need to examine the Nasdaq — New 52-Week Highs. There is one bearish divergence, this indicates an internal weakening of the small cap rally. Usually it takes several bearish divergences of new highs before a major peak occurs. If the current rally does top in a few days, the new highs single divergence is more evidence of only an intermediate peak. |

|
| Figure 3. There is one bearish divergence. This indicates an internal weakening of the small cap rally. |
| Graphic provided by: StockCharts.com. |
| |
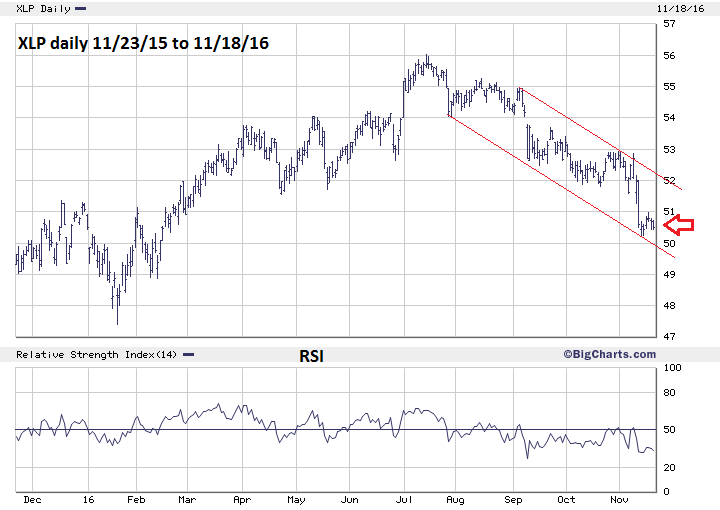
| Consumer Staples Select SPDR Fund (XLP) Please see the XLP daily chart illustrated in Figure 4. Most of the time since the major stock bottom in March 2009, XLP has outperformed the S&P 500 (SPX). Since this ETF peaked on July 14th it's down 9.8%. Even more amazing is that from the bottom made on November 4th the SPX is up 4.6% while the XLP is down 2.1%. This is the strongest single piece of evidence that the current steep rally in RUT, and the three main US stock indices, may be nearing an end. |

|
| Figure 4. This is the strongest single piece of evidence that the current steep rally in RUT, and the three main US stock indices, may be nearing an end. |
| Graphic provided by: BigCharts.com. |
| |
| Strategy and Summary Mid-November to April is seasonally bullish for stocks and November is usually the most bullish month. At the close of trading November 18th there are only six and a half trading days remaining in November. With the most bullish month nearly behind us and daily momentum indicators in the overbought zone, probabilities of a near term top have increased. My November 18th article recommended a 25% short position on stocks. Increase the short to 50% as soon as possible. Maintain the stop loss at SPX 2235. The ultimate trader is the ultimate opportunist. Opportunity is knocking. Further Reading: Frost A.J and Robert Prechter (1985) "Elliott Wave Principle", New Classics Library. |
Independent investment advisor, trader and writer. He has written articles for Technical Analysis of Stocks & Commodities, Traders.com Advantage,Futuresmag.com and, Finance Magnates. Author of website Four Dimension Trading.
| Website: | www.fourdimensiontrading.com |
| E-mail address: | markrivest@gmail.com |
Click here for more information about our publications!
Comments
Date: 12/01/16Rank: 1Comment:
Date: 12/04/16Rank: 1Comment:

Request Information From Our Sponsors
- StockCharts.com, Inc.
- Candle Patterns
- Candlestick Charting Explained
- Intermarket Technical Analysis
- John Murphy on Chart Analysis
- John Murphy's Chart Pattern Recognition
- John Murphy's Market Message
- MurphyExplainsMarketAnalysis-Intermarket Analysis
- MurphyExplainsMarketAnalysis-Visual Analysis
- StockCharts.com
- Technical Analysis of the Financial Markets
- The Visual Investor
- VectorVest, Inc.
- Executive Premier Workshop
- One-Day Options Course
- OptionsPro
- Retirement Income Workshop
- Sure-Fire Trading Systems (VectorVest, Inc.)
- Trading as a Business Workshop
- VectorVest 7 EOD
- VectorVest 7 RealTime/IntraDay
- VectorVest AutoTester
- VectorVest Educational Services
- VectorVest OnLine
- VectorVest Options Analyzer
- VectorVest ProGraphics v6.0
- VectorVest ProTrader 7
- VectorVest RealTime Derby Tool
- VectorVest Simulator
- VectorVest Variator
- VectorVest Watchdog
