

HOT TOPICS LIST
- MACD
- Fibonacci
- RSI
- Gann
- ADXR
- Stochastics
- Volume
- Triangles
- Futures
- Cycles
- Volatility
- ZIGZAG
- MESA
- Retracement
- Aroon
INDICATORS LIST
LIST OF TOPICS
PRINT THIS ARTICLE
by Mark Rivest
See what the indicators and price pattern reveal about the post-election stock market rally.
Position: Sell
Mark Rivest
Independent investment advisor, trader and writer. He has written articles for Technical Analysis of Stocks & Commodities, Traders.com Advantage,Futuresmag.com and, Finance Magnates. Author of website Four Dimension Trading.
PRINT THIS ARTICLE
MARKET TIMING
Blow Off Top or Kick Off Rally
11/18/16 02:49:27 PMby Mark Rivest
See what the indicators and price pattern reveal about the post-election stock market rally.
Position: Sell
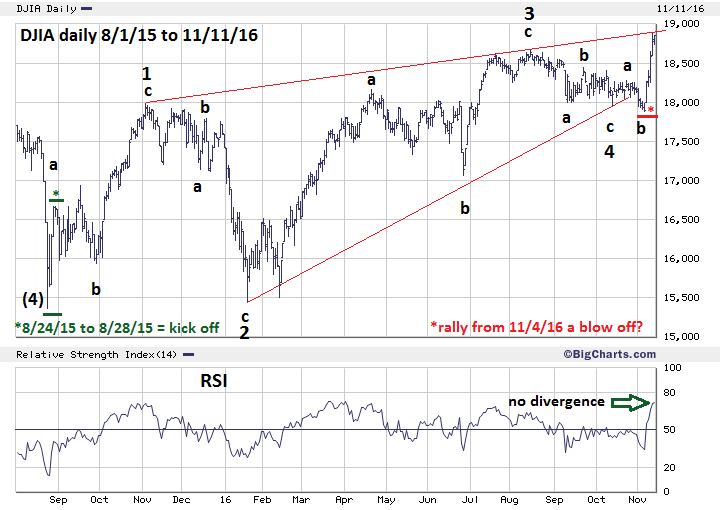
| The results of the US presidential election were stunning, even more surprising was the stock market reaction. For several weeks, the US stock market had been indicating a Clinton victory was bullish. Bad news for Clinton was greeted with a sharp decline, good news triggered a rally. The prospect of a Trump victory caused a huge decline in over-night futures trading, but after he had won the futures began to rally. When the cash market began trading at 9:30 AM-ET the decline only lasted one minute and didn't even come close to the November 4th bottom, let alone the much lower Brexit June 27th bottom. The post-election rally has been spectacular, and some analysts are hailing it as the start of a new Trump bull market. Is it? An examination of price, time, and, momentum indicate mixed signals. Dow Jones Industrial Average The Dow Jones Industrial Average (DJIA) has taken over as the lead, by being the first of the three main US stock indices to exceed its pre-election peak. Please see the daily DJIA chart illustrated in Figure 1. The DJIA move up from the August 24, 2015 bottom appears to be a nearly completed Elliott wave Ending Diagonal Triangle (EDT). An EDT is a termination wave occurring only in wave "5" and "C". It takes the form of a wedge and each of the five sub-waves divide into three wave patterns. Typically wave five of an EDT will have a brief throw over of the trendline that connects the termination points of waves one and three. Typically, within a five wave Elliott pattern, wave "5" is related to wave "1", either by equality or the Fibonacci ratio of .618. The supposed wave "5" up from August 24, 2015 would be related to the possible DJIA wave "1" rally from June 2010 to May 2011. (Note: the March 2009 to April 2010 wave would be either a larger degree wave "1" or wave "A". Please see Figure 2 in my article "How to Find Major Turns in Any Market".) The rally from June 2010 to May 2011 was 33.9% multiplied by .618 equals 20.9%. The August 24, 2015 bottom was 15,370, adding 20.9% growth targets DJIA 18,593 — the high so far is 18,873. Another interesting aspect of the DJIA bull move from August 24, 2015 is that it began with a kickoff rally. Note the four-day 8.4% rally from the August 24, 2015 bottom. Strong sharp rallies such as this usually happen after a significant decline, which in this case was a 16.2% drop in just over three months. Blow off tops come at the end of a bull cycle and they don't happen very often, the last one for the DJIA was the 6.4% rally from April 18th - May 2nd 2011. So far the four-day rally from November 4, 2016 is 5.5%. However, the preceding nearly three-month decline was only 5.5% — not significant — making it more likely the rally from November 4th is a blow off top. |
|
| Figure 1. Blow off tops come at the end of a bull cycle and they don�t happen very often. |
| Graphic provided by: BigCharts.com. |
| |
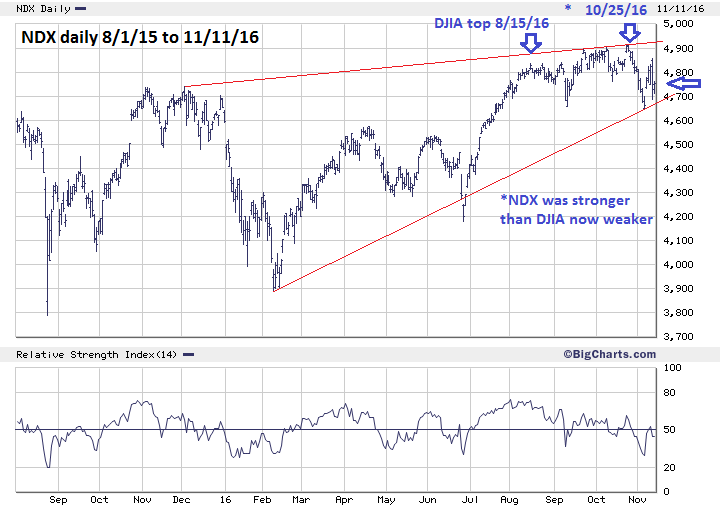
| Nasdaq 100 For several months, up until its peak on October 25th the Nasdaq 100 (NDX) had been the strongest US stock index. Please see the daily NDX chart illustrated in Figure 2. Since October 25th the NDX has underperformed the DJIA. November 10th was a dramatic demonstration — the DJIA was up 1.1% while the NDX was down 1.2%. Perhaps this under-performance is because important stocks within the NDX, such as Amazon, Facebook, and Alphabet, needed to correct. When the DJIA begins to decline, watch the NDX. If it stabilizes this would be bullish and a clue that the bull market is still alive. If the NDX joins the decline and breaks below its November 4th bottom it would be a clue that the bears are in control. |
|
| Figure 2. Since October 25th the NDX has under-performed the DJIA. |
| Graphic provided by: BigCharts.com. |
| |
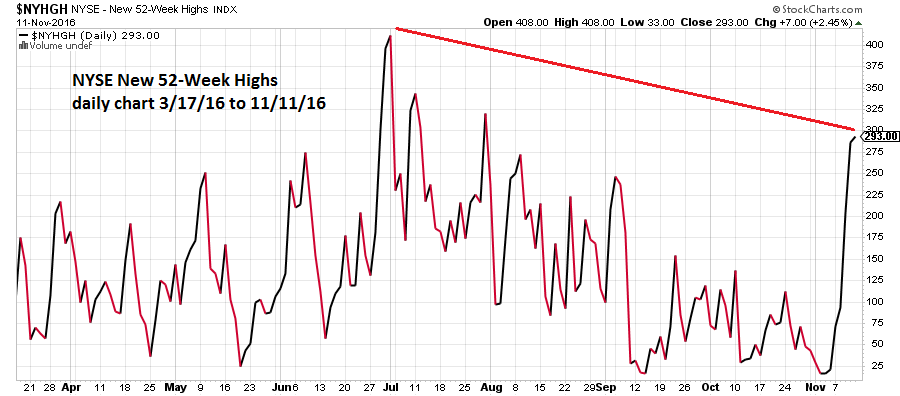
| NYSE New 52-Week Highs There are two ways to analyze any stock index, externally and internally. External analysis is examination of price patterns and support/resistance levels. Internal analysis deals with advances/declines of index components and stocks making new 52-week highs/lows. Please see the daily NYSE New 52-Week Highs chart illustrated in Figure 3. With the DJIA at all-time highs and the S&P 500 (SPX) close to its all-time high, the number of NYSE new 52-week highs still have a significant bearish divergence versus the maximum hit in early July. This is a clue that the DJIA and SPX could still be near a significant top. |
|
| Figure 3. This is a clue that the DJIA and SPX could still be near a significant top. |
| Graphic provided by: StockCharts.com. |
| |
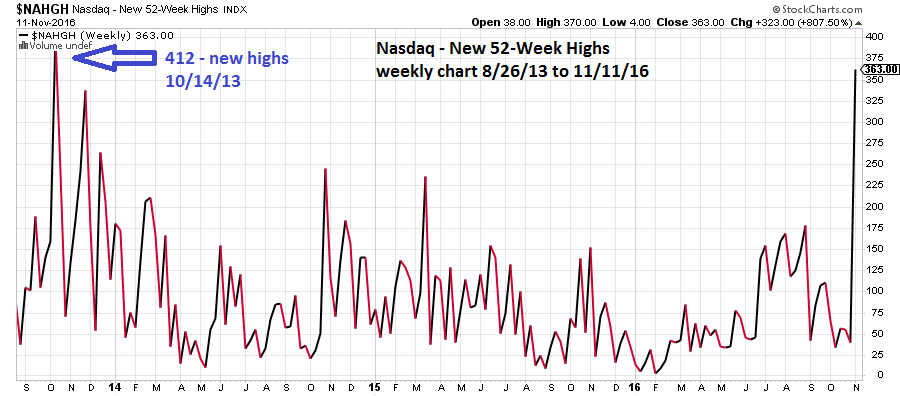
| Nasdaq New 52-Week Highs Please see the weekly Nasdaq New 52-Week Highs chart illustrated in Figure 4. The Nasdaq rally since November 4th has seen a huge surge in stocks making new 52-week highs, blowing away bearish divergences going back more than two years. This surge implies the Nasdaq could have several months more to rally before a peak is in place. This is very curious since the NDX and, to a lesser degree, the main Nasdaq Composite have been lagging the DJIA. Regardless the surge is bullish. As is seasonality. Mid-November to early April is usually a bullish time for stocks. |
|
| Figure 4. This surge implies the Nasdaq could have several months more to rally before a peak is in place. |
| Graphic provided by: StockCharts.com. |
| |
| Summary and Strategy It's a mixed picture... the DJIA pattern is bearish and near Fibonacci resistance. NYSE new highs are bearish while Nasdaq new highs are bullish. Seasonality is bullish. My last article "Too Close to Call" noted that November 15th was a Fibonacci time cycle turn and that November 14th was a full moon. Its possible stocks could top in this time zone, and seasonal factors could keep the decline shallow, perhaps 3 to 4%, then meander sideways for several weeks before a more serious decline occurs. Another scenario would be a shallow 3 to 4% decline then a rally to new highs. My last article recommended lowering the stop loss on short positions to SPX 2181 which was hit on November 10th. If stocks rally into the Fibonacci time zone of November 14-15 enter a 25% short position with a stop loss at SPX 2235. Further Reading: Frost A.J and Robert Prechter (1985) "Elliott Wave Principle", New Classics Library. |
Independent investment advisor, trader and writer. He has written articles for Technical Analysis of Stocks & Commodities, Traders.com Advantage,Futuresmag.com and, Finance Magnates. Author of website Four Dimension Trading.
| Website: | www.fourdimensiontrading.com |
| E-mail address: | markrivest@gmail.com |
Click here for more information about our publications!
Comments
Date:�11/19/16Rank:�1Comment:�

Request Information From Our Sponsors
- StockCharts.com, Inc.
- Candle Patterns
- Candlestick Charting Explained
- Intermarket Technical Analysis
- John Murphy on Chart Analysis
- John Murphy's Chart Pattern Recognition
- John Murphy's Market Message
- MurphyExplainsMarketAnalysis-Intermarket Analysis
- MurphyExplainsMarketAnalysis-Visual Analysis
- StockCharts.com
- Technical Analysis of the Financial Markets
- The Visual Investor
- VectorVest, Inc.
- Executive Premier Workshop
- One-Day Options Course
- OptionsPro
- Retirement Income Workshop
- Sure-Fire Trading Systems (VectorVest, Inc.)
- Trading as a Business Workshop
- VectorVest 7 EOD
- VectorVest 7 RealTime/IntraDay
- VectorVest AutoTester
- VectorVest Educational Services
- VectorVest OnLine
- VectorVest Options Analyzer
- VectorVest ProGraphics v6.0
- VectorVest ProTrader 7
- VectorVest RealTime Derby Tool
- VectorVest Simulator
- VectorVest Variator
- VectorVest Watchdog