

HOT TOPICS LIST
- MACD
- Fibonacci
- RSI
- Gann
- ADXR
- Stochastics
- Volume
- Triangles
- Futures
- Cycles
- Volatility
- ZIGZAG
- MESA
- Retracement
- Aroon
INDICATORS LIST
LIST OF TOPICS
PRINT THIS ARTICLE
by Mark Rivest
Using the four market dimensions to discover important market tops and bottoms.
Position: N/A
Mark Rivest
Independent investment advisor, trader and writer. He has written articles for Technical Analysis of Stocks & Commodities, Traders.com Advantage,Futuresmag.com and, Finance Magnates. Author of website Four Dimension Trading.
PRINT THIS ARTICLE
MARKET TIMING
How to Find Major Turns in Any Market
10/14/16 12:41:10 PMby Mark Rivest
Using the four market dimensions to discover important market tops and bottoms.
Position: N/A
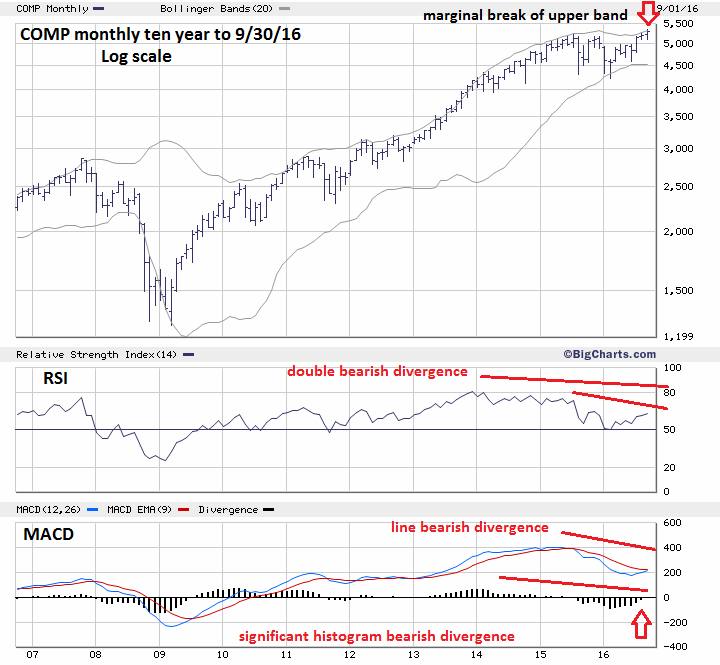
| When navigating on land, you would first determine longitude and latitude, then look for land marks such as a lakes and hills to confirm your location. When navigating the markets, the dimensions of price and time take the place of longitude and latitude. Confirmation comes from the dimensions of sentiment and momentum. Each dimension has several elements, some will be bullish, some bearish. The weight of the evidence will determine if the dimension is either net bullish or bearish. About once or twice a year any market can have a situation in which all four dimensions are either net bullish or bearish. When this condition occurs a major market trend change is likely to happen. The US stock market during August-September 2016 showed all four dimensions as bearish; a major move down is imminent. Momentum and Time Dimensions Please see the monthly Nasdaq Composite (COMP) chart illustrated in Figure 1. My last article, "Nasdaq Versus the World", noted the very bearish condition of COMP. This current article is a companion piece. Please read both articles to grasp the total picture for COMP and the global stock market. The monthly Comp chart illustrates several long term bearish momentum signals. The current monthly RSI is diverging from the level at July 2015, which itself is a divergence from the level in early 2014. The monthly MACD is showing significant bearish divergences on both the histogram and line. There is a bearish signal coming from the upper monthly Bollinger band as the price bar moved above the band, this is usually a sell signal especially if the upper band is flat or rising at a shallow angle. This one chart provides enough evidence to warrant a bearish stance on stocks, yet there's even more bearish evidence from the time dimension. September through October is notoriously a bearish season for stocks. September 30th was the end of the third quarter, and its typical for stocks to rally on the last day of a quarter as fund managers buy top performing stocks to show that they have them in the portfolio. COMP rallied on September 30th and made a slightly lower top to the so far high of the year made on September 22nd. Also, there was a new moon on the 30th — markets occasionally will turn on new of full moons. It's possible September 30th could be the last gasp for the bulls and October could see stocks coming down hard. |
|
| Figure 1. The monthly Comp chart illustrates several long term bearish momentum signals. |
| Graphic provided by: BigCharts.com. |
| |
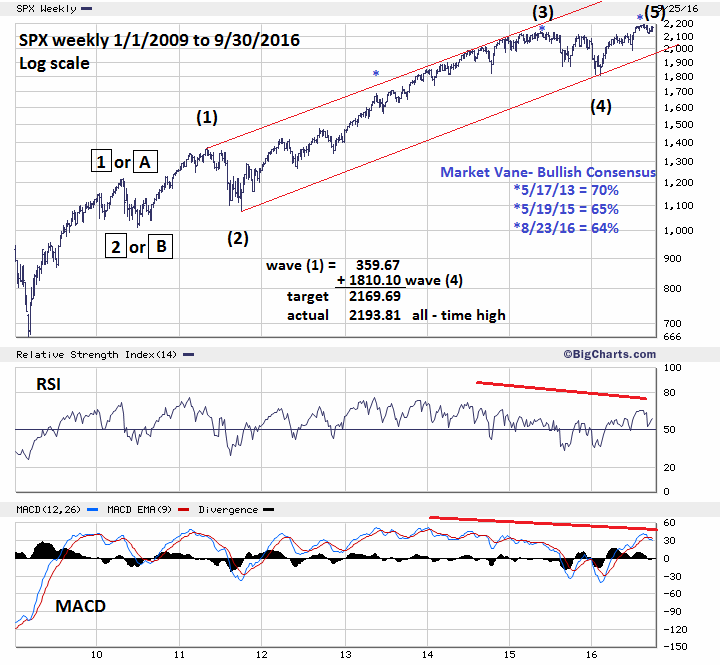
| Price and Sentiment Dimensions Please see the weekly S&P 500 (SPX) chart illustrated in Figure 2. The parallel trend channel helps to illustrate a five wave Elliott pattern from the bottom in 2010. My July 20th article "Stocks - Up, Up and Away" mentioned that .618 of the SPX February to June rally added to the bottom made on June 27th targeted SPX 2183.53 as a possible top. The high so far is 2193.81. Normally, when a market has a large percentage gain the best wave to calculate Fibonacci turn points is by comparing the percentage gains of each wave. The reason, a 100 point move up from 1000 is a larger percentage gain than a 100 point move up from 2000. However, sometimes you can derive Fibonacci turns using arithmetic scale even when a market has made a large percentage move up. Usually, in an Elliott five wave pattern wave "one" equals wave "five". The rally from 2010-2011 labeled (1) was 359.67, adding this to Wave (4) at SPX 1810.10 targets SPX 2169.77 — only 24.12 points from the actual high of the year. A long term Fibonacci coordinate from 2010-2011 and an intermediate coordinate from 2016 targeting the same general area is powerful price dimension evidence for a probable top. There are several ways to measure the sentiment dimension such as put/call ratios and Commitment of Traders report. The Market Vane - Bullish Consensus is another way to measure sentiment. Every week traders are polled to determine if they are bullish or bearish. Low percentages like 20% represent an extreme in bearishness. High numbers like 80% represent extreme bullishness. This method was developed by R. Earl Hadady and explained in his book "Contrary Opinion". There are two ways to interpret the data; very high/low numbers usually indicate a market turn is coming. Or, in some markets — and the stock market in particular — the turns come not at the extremes, but on a divergence. Note that the highest reading since the 2010 bottom came at peak in May 2013. This is very interesting because May 2013 marks the exact center of the Elliott five wave from 2010. It is the third of a third wave and is usually the most dynamic part of a stock bull market. It is in this area where you will usually see the greatest number of stocks advancing and making new highs. So it's logical that the highest sentiment readings would come in this area. Stock bull markets almost always end with a whimper, not a bang. |
|
| Figure 2. Stock bull markets almost always end with a whimper, not a bang. |
| Graphic provided by: BigCharts.com. |
| |
| Summary and Strategy The overwhelming evidence from all four market dimensions indicate a sharp downturn could be imminent. Maintain the stop loss on remaining long positions at SPX 2118. If not already short initiate a 25% short position using SPX 2270 as the stop loss level. Most traders think in only one or two dimensions. Expand your mind to all four market dimensions and step into the profit zone. Further Reading: Frost A.J and Robert Prechter (1985) "Elliott Wave Principle", New Classics Library. |
Independent investment advisor, trader and writer. He has written articles for Technical Analysis of Stocks & Commodities, Traders.com Advantage,Futuresmag.com and, Finance Magnates. Author of website Four Dimension Trading.
| Website: | www.fourdimensiontrading.com |
| E-mail address: | markrivest@gmail.com |
Click here for more information about our publications!
Comments
Date:�10/30/16Rank:�5Comment:�

Request Information From Our Sponsors
- StockCharts.com, Inc.
- Candle Patterns
- Candlestick Charting Explained
- Intermarket Technical Analysis
- John Murphy on Chart Analysis
- John Murphy's Chart Pattern Recognition
- John Murphy's Market Message
- MurphyExplainsMarketAnalysis-Intermarket Analysis
- MurphyExplainsMarketAnalysis-Visual Analysis
- StockCharts.com
- Technical Analysis of the Financial Markets
- The Visual Investor
- VectorVest, Inc.
- Executive Premier Workshop
- One-Day Options Course
- OptionsPro
- Retirement Income Workshop
- Sure-Fire Trading Systems (VectorVest, Inc.)
- Trading as a Business Workshop
- VectorVest 7 EOD
- VectorVest 7 RealTime/IntraDay
- VectorVest AutoTester
- VectorVest Educational Services
- VectorVest OnLine
- VectorVest Options Analyzer
- VectorVest ProGraphics v6.0
- VectorVest ProTrader 7
- VectorVest RealTime Derby Tool
- VectorVest Simulator
- VectorVest Variator
- VectorVest Watchdog