HOT TOPICS LIST
- MACD
- Fibonacci
- RSI
- Gann
- ADXR
- Stochastics
- Volume
- Triangles
- Futures
- Cycles
- Volatility
- ZIGZAG
- MESA
- Retracement
- Aroon
INDICATORS LIST
LIST OF TOPICS
PRINT THIS ARTICLE
by Mark Rivest
See why the Nasdaq Composites September 22, 2016 unconfirmed all-time high could be the prelude to a sharp decline.
Position: N/A
Mark Rivest
Independent investment advisor, trader and writer. He has written articles for Technical Analysis of Stocks & Commodities, Traders.com Advantage,Futuresmag.com and, Finance Magnates. Author of website Four Dimension Trading.
PRINT THIS ARTICLE
MOMENTUM
Nasdaq Versus The World
10/03/16 04:21:22 PMby Mark Rivest
See why the Nasdaq Composites September 22, 2016 unconfirmed all-time high could be the prelude to a sharp decline.
Position: N/A
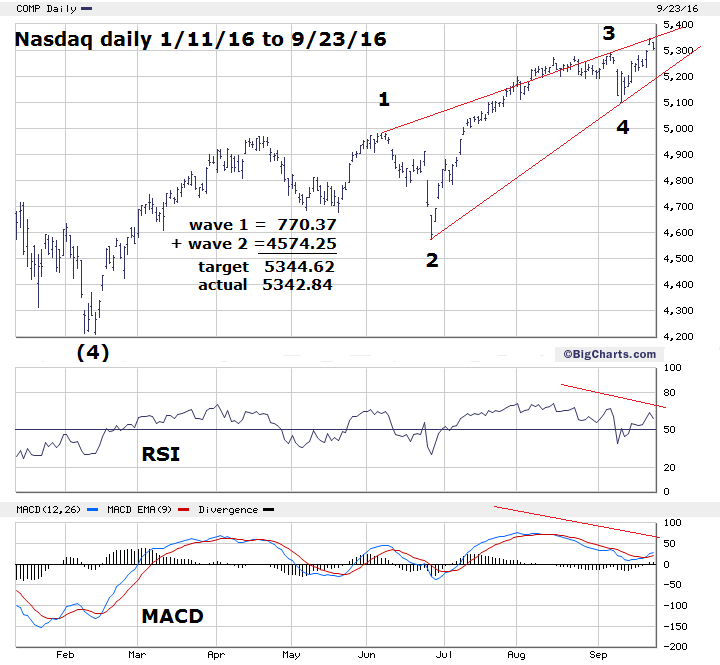
| On July 20, 2015, the Nasdaq (COMP) made an all-time high that was unconfirmed by the Dow Jones Industrial Average (DJIA) and the S&P 500 (SPX). My July 30, 2015 article "A Ludicrous Non-Confirmation" noted that the new Nasdaq high was unconfirmed by nearly every other stock index and that a sharp move down in stocks had begun. Subsequent to that article the Nasdaq declined over 17%, bottoming on August 24, 2015. The evidence at the Nasdaq September 22, 2016 peak is more bearish than the top made in July 2015 and implies an even greater decline than 17%, perhaps as much as 21%, by late October or early November 2016. Price Dimension My July 20, 2016 article, "Stocks - UP, Up and Away", noted an SPX alternate count in which there was Fibonacci resistance at SPX 2183.53 and a possible top somewhere around SPX 2200. On August 15th the SPX topped at 2193.81 and as of September 23rd has held. Please see the Nasdaq daily chart illustrated in Figure 1. Using a Fibonacci calculation that is similar to the method used for the SPX indicates the COMP had a near bulls-eye hit of a major Fibonacci target at 5344.62. Very short term there is a possibility this target price could be exceeded. If so, it should only be by a marginal amount. The Elliott wave pattern from the February 11th bottom appears to be an Ending Diagonal Triangle. In this price structure, wave "four" almost always crosses into the territory of wave "one". The current COMP Ending Diagonal Triangle is a rare example where wave "four" does not cross into the territory of wave "one". |

|
| Figure 1. The Elliott wave pattern from the February 11th bottom appears to be an Ending Diagonal Triangle. |
| Graphic provided by: BigCharts.com. |
| |
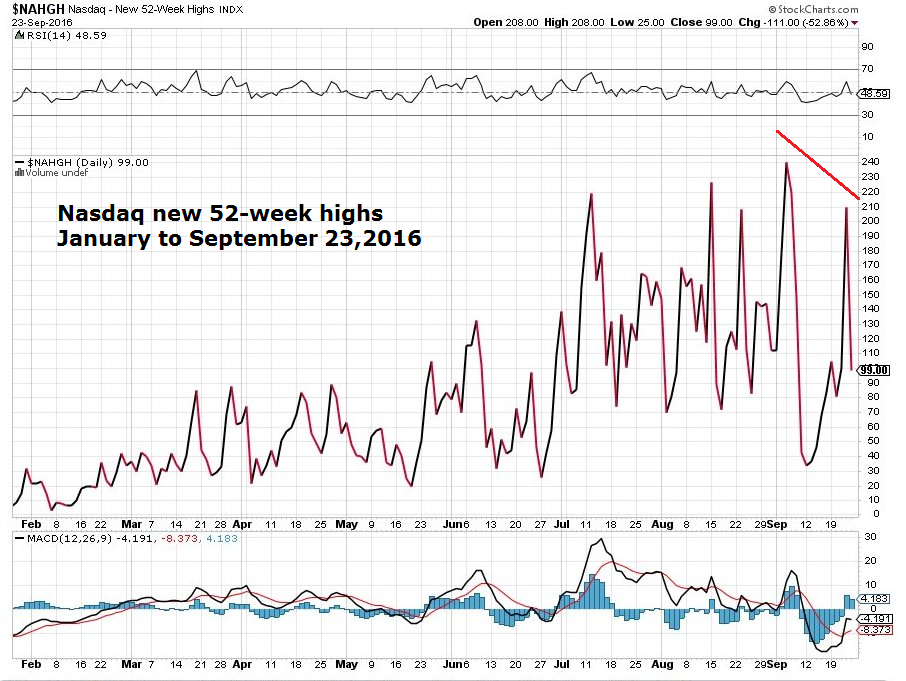
| Momentum Dimension Note, on the Nasdaq daily chart the recent high was accompanied by a significant MACD bearish divergence, as well as a double bearish divergence on the RSI. Also not shown for the sake of clarity, on September 22nd the daily price bar went above the upper Bollinger band which usually signals a top. Please see the Nasdaq new 52-week high chart illustrated in Figure 2. Internally, the condition of COMP is bearish as the number of stocks making new 52-week highs dropped off significantly from the peak made in early September. There are also bearish signals coming from the FANG stocks; Facebook (FB), Amazon (AMZN), Netflix (NFLX), and Alphabet (GOOGL). NFLX peaked at 133.27 on December 7, 2015 and closed September 22nd at 95.87. On September 22nd FB failed to exceed its high that was made on September 7th. Only AMZN and GOOGL were able to confirm the COMP's all-time high. |

|
| Figure 2. Internally, the condition of COMP is bearish as the number of stocks making new 52-week highs dropped off significantly from the peak made in early September. |
| Graphic provided by: StockCharts.com. |
| |
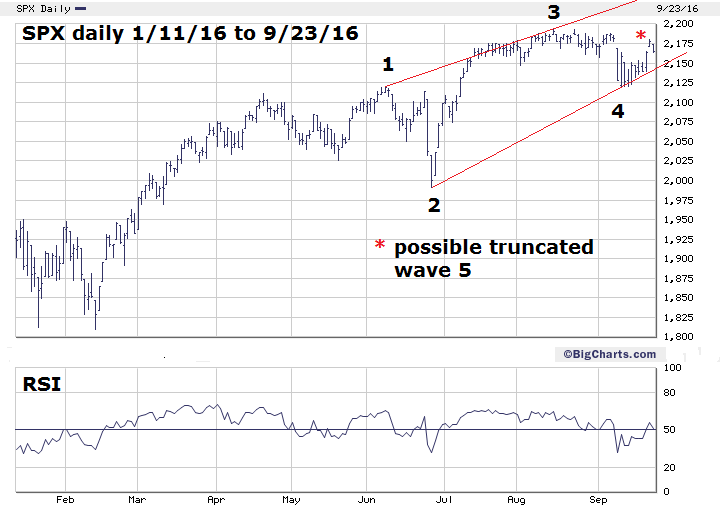
| S&P 500 Elliott Wave Structure Please see the daily SPX chart illustrated in Figure 3. In my September 15th article, "Stock Market Lessons from Mr. Fibonacci- Part Three", I noted that the Dow Jones Transportation Average may have had a truncated wave "C". In this case wave "C" failed to exceed the termination point of wave "A". Truncation can also occur in five wave patterns in which wave "5" fails to exceed the termination point of wave "3". This appears to be what may be happening with the SPX. The best Elliott wave pattern for the SPX since the February 11th bottom is still an Ending Diagonal Triangle. In rising markets Ending Diagonal Triangles are very bearish and they normally retrace quickly to their point of origin, which in this case is the February 11th bottom. Truncated waves in a rising market are also a very bearish signal. A truncated wave "5" in an Ending Diagonal Triangle is a super bearish signal! |

|
| Figure 3. A truncated wave "5" in an Ending Diagonal Triangle is a super bearish signal! |
| Graphic provided by: BigCharts.com. |
| |
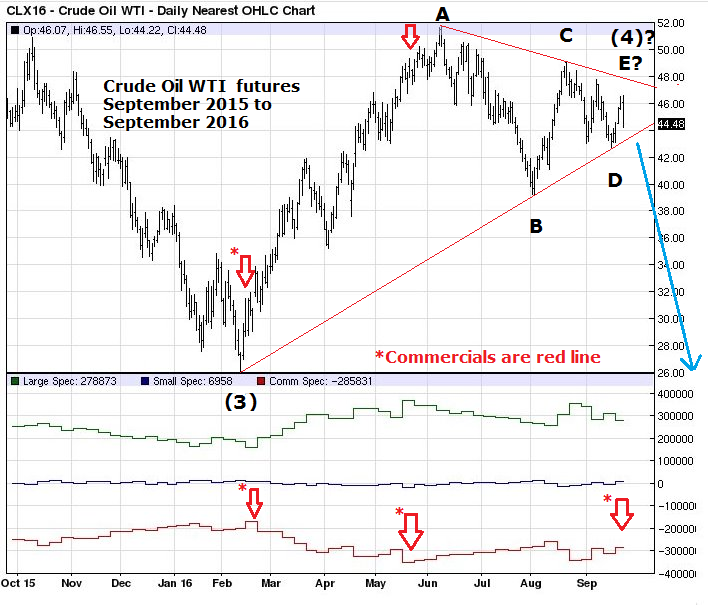
| Catalyst For A Large Stock Market Decline There are many reasons why the stock market could have a large decline — the US presidential election is not one of those reasons. No one person has the power to move any market to a significant degree. Markets have large moves because of large fundamental factors. Please see the Crude Oil futures chart illustrated in Figure 4. In 2008 both stocks and Crude Oil had significant declines, the reason, a slowing economy. Perhaps the same could be happening in late 2016? The daily Crude Oil chart shows that an Elliott wave Horizontal Triangle may have just completed. If so, the next move could be a sharp decline at least back to the low of the year at $26. The Commitment of Traders report is bearish. The Commercials, the group with the most money, still have a significant net short position. Note that their largest short position was in May just before the price high of the year. If Crude Oil does have a sharp decline it would probably bottom in late October or early November. |

|
| Figure 4. The Commercials, the group with the most money, still have a significant net short position. |
| Graphic provided by: Barcharts.com. |
| |
| Additional Momentum Evidence And Strategy The Nasdaq July 20, 2015 top was confirmed by five of the nine SPDR sector funds. The September 22, 2016 Nasdaq peak was confirmed only by the Technology sector fund (XLK). The COMP September 22, 2016 top was unconfirmed by the other two main US stock indices SPX and DJIA. Of the secondary stock indices, the Dow Transports and Utilities failed to confirm the top. The S&P 600, 400, and 100 failed to confirm the top. The Russell 1000 and 2000 failed to confirm the top. The NYSE composite failed to confirm the top. Only the Nasdaq 100 confirmed the top. The July 2015 COMP peak was unconfirmed by all of the major international stock indices. In 2016, with the COMP even higher than it was in 2015, almost all of the major international stock indices are significantly lower than where they were in July 2015. Only the FTSE 100 is trading above its July 2015 level, yet still below its April 2015 high. This is conclusive evidence that COMP is significantly more bearish now than the peak it made in 2015. There is a high probability a subsequent decline could be larger than the decline July -August 2015. The technical condition of the US stock market in September 2016 is the exact opposite of the condition in February of this year, please see my article "Bullish Divergence Abound". As soon as possible, initiate a 25% short stock position. Use SPX 2270 as a stop loss. Raise the stop loss on remaining long positions to SPX 2118. Further Reading: Frost A.J and Robert Prechter (1985) "Elliott Wave Principle", New Classics Library. |
Independent investment advisor, trader and writer. He has written articles for Technical Analysis of Stocks & Commodities, Traders.com Advantage,Futuresmag.com and, Finance Magnates. Author of website Four Dimension Trading.
| Website: | www.fourdimensiontrading.com |
| E-mail address: | markrivest@gmail.com |
Click here for more information about our publications!
Comments
Date: 10/30/16Rank: 5Comment:

|

Request Information From Our Sponsors
- StockCharts.com, Inc.
- Candle Patterns
- Candlestick Charting Explained
- Intermarket Technical Analysis
- John Murphy on Chart Analysis
- John Murphy's Chart Pattern Recognition
- John Murphy's Market Message
- MurphyExplainsMarketAnalysis-Intermarket Analysis
- MurphyExplainsMarketAnalysis-Visual Analysis
- StockCharts.com
- Technical Analysis of the Financial Markets
- The Visual Investor
- VectorVest, Inc.
- Executive Premier Workshop
- One-Day Options Course
- OptionsPro
- Retirement Income Workshop
- Sure-Fire Trading Systems (VectorVest, Inc.)
- Trading as a Business Workshop
- VectorVest 7 EOD
- VectorVest 7 RealTime/IntraDay
- VectorVest AutoTester
- VectorVest Educational Services
- VectorVest OnLine
- VectorVest Options Analyzer
- VectorVest ProGraphics v6.0
- VectorVest ProTrader 7
- VectorVest RealTime Derby Tool
- VectorVest Simulator
- VectorVest Variator
- VectorVest Watchdog
