

HOT TOPICS LIST
- MACD
- Fibonacci
- RSI
- Gann
- ADXR
- Stochastics
- Volume
- Triangles
- Futures
- Cycles
- Volatility
- ZIGZAG
- MESA
- Retracement
- Aroon
INDICATORS LIST
LIST OF TOPICS
PRINT THIS ARTICLE
by Mark Rivest
The incredible string of Fibonacci turn dates continues. See why September 14, 2016 could be the next bottom.
Position: N/A
Mark Rivest
Independent investment advisor, trader and writer. He has written articles for Technical Analysis of Stocks & Commodities, Traders.com Advantage,Futuresmag.com and, Finance Magnates. Author of website Four Dimension Trading.
PRINT THIS ARTICLE
FIBONACCI
Stock Market Lessons from Mr. Fibonacci - Part Three
09/15/16 05:20:17 PMby Mark Rivest
The incredible string of Fibonacci turn dates continues. See why September 14, 2016 could be the next bottom.
Position: N/A
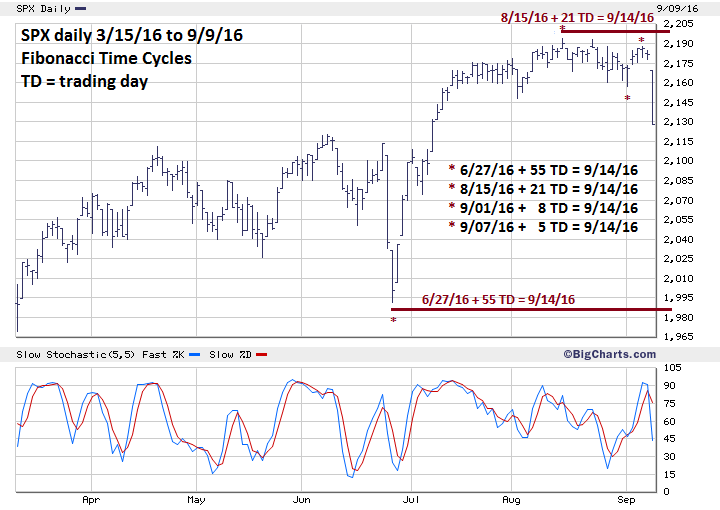
| After R.N Elliott discovered the "wave principle" he made another discovery, that markets sometimes move in increments measured by the Fibonacci sequence. Since April 20th of this year the S&P 500 (SPX) has had six consecutive turns related to the Fibonacci sequence. The next possible Fibonacci turn date is September 14, 2016 and with the deep decline on September 9th there is a high probability this turn could be a bottom. The timing technique of using the Fibonacci sequence can be used in any market. At some point this current amazing sequence of SPX Fibonacci market turns will end, but will occur again either in stocks or another market. Fibonacci Time Targets The Fibonacci sequence is (1, 1, 2, 3, 5, 8, 13, 21, 34, 55, 89, 144, 233, to infinity). In my last article "Stock Market Lessons from Mr. Fibonacci - Part Two" I noted that by adding 144 trading days to the February 11, 2016 bottom targeted September 7th as the next possible turn date. Adding 144 trading days to the prior January 20, 2016 bottom successfully targeted the August 15th SPX peak. I speculated that because there was a double bottom made in January and February, the SPX may form a double top August to September. I was expecting a marginally higher second peak; as it turned out the September top was marginally lower than the primary peak made on August 15th. Also note that the September 7th top had a secondary Fibonacci time coordinate of 3 trading days after the September 1st bottom. Please see the daily SPX chart illustrated in Figure 1. Having more than one Fibonacci time coordinate increases the probability that a market turn may occur. The projected September 14th turn has four time coordinates indicating a very high probability of a turn occurring on that day. Having four time coordinates doesn't increase the importance of a possible bottom, only that we can expect some type of turn. What could happen: the SPX bottoms on September 14th, rallies for a few days, then turn lower going below the September 14th bottom. Remember this short term time cycle is coming during a seasonally bearish time and there could be downside surprises between now and the end of October. |
|
| Figure 1. Having more than one Fibonacci time coordinate increases the probability that a market turn may occur. |
| Graphic provided by: BigCharts.com. |
| |
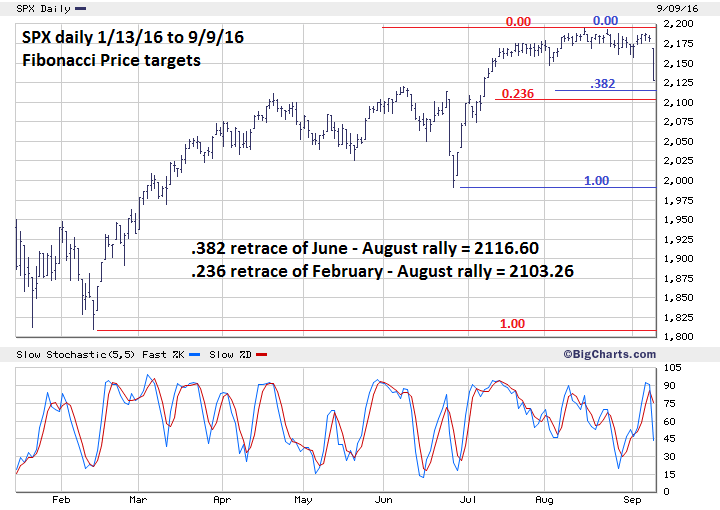
| Fibonacci Price Targets Please see the daily SPX chart illustrated in Figure 2. My August 29th article noted two Fibonacci SPX support levels; one at SPX 2116.60 and the other at SPX at 2103.26, so allowing for leeway the broader price target zone is SPX 2100 - 2120. On the intraday chart the sharp decline on September 9th looks very much like an Elliott wave third of a third down, which the vast majority of the time are very dynamic. If this count is correct in the next two to three trading days, the SPX will probably chop its way lower in an Elliott wave series of fours and fives and bottom somewhere in the 2100 - 2120 target zone. It's possible the SPX could have a convergence of price and time targets on September 14th. |
|
| Figure 2. It�s possible the SPX could have a convergence of price and time targets on September 14th. |
| Graphic provided by: BigCharts.com. |
| |
| Dow Jones Transportation Average My September 9th article noted that the Dow Jones Transportation Average (DJTA) needed to reach 8149.01 for confirmation of completion of an Elliott wave A-B-C correction from the 2016 bottom. The vast majority of the time wave "C" exceeds the termination point of wave "A". Sometimes wave "C" fails to exceed wave "A" in what's referred to as a truncated wave "C". The problem with truncated waves is that they are very difficult to catch in real time and you may not be able to recognize them until well after the fact. On September 8th, the DJTA reached 8083.30 which is 65.71 points below the confirmation level. On September 9th, the DJTA dropped hard with the rest of the stock market, it's possible a very important peak was registered on September 8th. Elliott wave confirmation that this was a wave "C" peak may not come for several weeks. For now we will have to assume an important top was made on September 8th and examine this index at a later date. |
| Strategy and Summary In several of my recent articles I've mentioned that the best Elliott wave count for the SPX is that from the February 11th bottom, five waves up are in development and that a decline to SPX 2100 - 2120 could be a fourth wave down. In non-Elliott terms this means a decline from SPX 2193 to 2100 - 2120 would be just a correction within an ongoing bull market. The alternate Elliott wave count implies a decline all the way down to major support at SPX 1800, which could happen before the end of October. There are two reasons why we should be defensive and prepare the possibility of a decline to SPX 1800. One, September to October is notoriously a bearish season. Two, as noted in my last article: Commercials have their largest short position on S&P 500 futures in more than one year. It's better to be safe than sorry. The recommendation in my last article was to raise the stop loss level for half of long positions at SPX 2156. The large decline on September 9th pushed below this level, half of long positions should be sold. Use SPX 2060 as the stop loss for remaining long positions. Don't let months, or even years of gains made on the long side disappear. A typical retort from traders and investors when the market is moving adversely to their positions is "I'll ride it out". Sadly, many times they end up not enjoying the ride. Further Reading: Frost A.J and Robert Prechter (1985) "Elliott Wave Principle", New Classics Library. |
Independent investment advisor, trader and writer. He has written articles for Technical Analysis of Stocks & Commodities, Traders.com Advantage,Futuresmag.com and, Finance Magnates. Author of website Four Dimension Trading.
| Website: | www.fourdimensiontrading.com |
| E-mail address: | markrivest@gmail.com |
Click here for more information about our publications!
Comments
Date:�09/23/16Rank:�5Comment:�nice
Date:�10/30/16Rank:�5Comment:�

Request Information From Our Sponsors
- StockCharts.com, Inc.
- Candle Patterns
- Candlestick Charting Explained
- Intermarket Technical Analysis
- John Murphy on Chart Analysis
- John Murphy's Chart Pattern Recognition
- John Murphy's Market Message
- MurphyExplainsMarketAnalysis-Intermarket Analysis
- MurphyExplainsMarketAnalysis-Visual Analysis
- StockCharts.com
- Technical Analysis of the Financial Markets
- The Visual Investor
- VectorVest, Inc.
- Executive Premier Workshop
- One-Day Options Course
- OptionsPro
- Retirement Income Workshop
- Sure-Fire Trading Systems (VectorVest, Inc.)
- Trading as a Business Workshop
- VectorVest 7 EOD
- VectorVest 7 RealTime/IntraDay
- VectorVest AutoTester
- VectorVest Educational Services
- VectorVest OnLine
- VectorVest Options Analyzer
- VectorVest ProGraphics v6.0
- VectorVest ProTrader 7
- VectorVest RealTime Derby Tool
- VectorVest Simulator
- VectorVest Variator
- VectorVest Watchdog