

HOT TOPICS LIST
- MACD
- Fibonacci
- RSI
- Gann
- ADXR
- Stochastics
- Volume
- Triangles
- Futures
- Cycles
- Volatility
- ZIGZAG
- MESA
- Retracement
- Aroon
INDICATORS LIST
LIST OF TOPICS
PRINT THIS ARTICLE
by Mark Rivest
See why the September 1, 2016 bottom could be the prelude to a major stock market peak.
Position: N/A
Mark Rivest
Independent investment advisor, trader and writer. He has written articles for Technical Analysis of Stocks & Commodities, Traders.com Advantage,Futuresmag.com and, Finance Magnates. Author of website Four Dimension Trading.
PRINT THIS ARTICLE
FIBONACCI
Stock Market Lessons from Mr. Fibonacci - Part Two
09/09/16 12:17:28 PMby Mark Rivest
See why the September 1, 2016 bottom could be the prelude to a major stock market peak.
Position: N/A
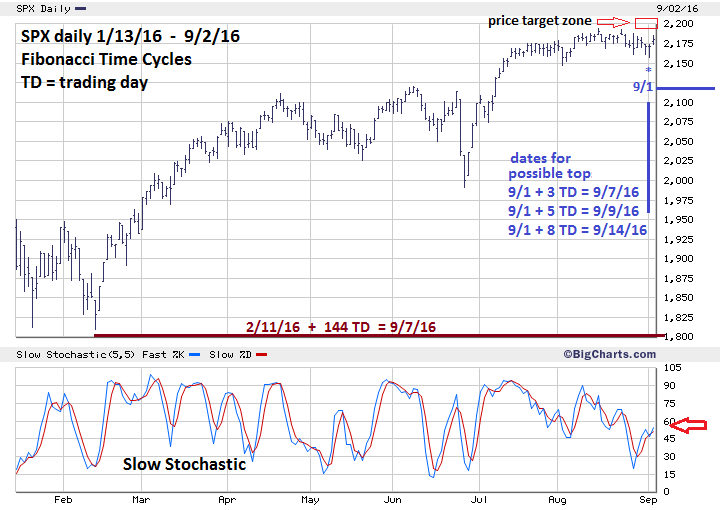
| My August 29th article "Stock Market Lessons from Mr. Fibonacci" had a very specific forecast calling for a sharp decline to the S&P 500 (SPX) area of 2100-2120 on September 1st. A low was made on September 1st at SPX 2157, nowhere near the target zone. What's happening? Is the SPX inability to decline 3% in one week a bullish sign or could something else be underway? An examination of the dimensions of price, time and sentiment reveal some fascinating clues. Price And Time Dimensions At the close on August 26 the SPX intraday Elliott wave pattern had the potential to break sharply to the downside at the open August 29th. The exact opposite happened with the SPX moving up and retracing most of the strong decline made on August 26. It then took nearly three days to make a marginal new low at SPX 2157.09. The intraday pattern over the last ten trading days is very choppy, which is characteristic of a correction within a rising market. Please see the daily SPX chart illustrated in Figure 1. The rally that came off the bottom made on September 1st is the largest within the last ten trading days. Additionally, the daily Slow Stochastic is rising and at the close of September 2nd was only in the middle of its range, implying higher prices coming in the next few trading days. It appears the bulls may want to make a run at stop buy orders just above the double top in the SPX 2193 area. If that resistance is breached there's round number resistance at 2200. There's also an intermediate degree Fibonacci resistance at 2200. The SPX June 8-27 decline was 128.87 points, multiplied by 1.618 equals 208.51, added to the June 27th bottom of 1991.68 targets SPX 2200.19. If the SPX can make a new 2016 high, then the September 1st bottom could be the fourth wave of a five wave Elliott pattern from the February 11th bottom. This would mean that the rally to a new 2016 high could be the fifth wave, and at its completion, the major peak. There are always various interpretations to any Elliott wave count, that's why to find the true count it's best to get confirmation from the dimensions of time, momentum and sentiment. As for the time dimension: September to October is a notoriously seasonal bearish period for stocks. Additionally, the phenomenon of the Fibonacci time sequence may still be a factor. In my August 29th article I illustrated that adding the Fibonacci number of 144 trading days to the January 20th bottom targeted the August 15th top. If you add 144 trading days to the marginally lower February 11th SPX bottom it yields a target of September 7th as a possible turn date. The SPX had a double bottom January and February. Maybe it will make a double top in August and September. September 7th is also confirmed by the Fibonacci sequence number "3". Using Fibonacci sequence numbers of 5 and 8 make September 9th and September 14th as dates for a possible SPX peak. |
|
| Figure 1. SPX Daily Chart. Daily Slow Stochastic is rising and at the close of September 2nd was only in the middle of its range, implying higher prices coming in the next few trading days. |
| Graphic provided by: BigCharts.com. |
| |
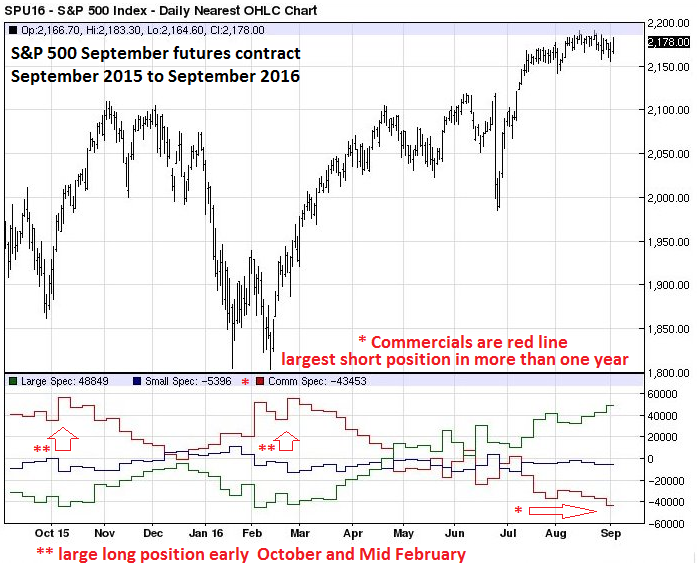
| Sentiment Dimension Please see the daily S&P 500 September futures chart illustrated in Figure 2. The Commitment of Trader's report is released once a week and tracks the net long or short positions of the three types of speculators: Small, Large, and Commercial. The Commercials are the group you want to follow; they have the most money and are the most informed. They are not infallible; on rare occasions they can be completely wrong. Occasionally, Commercials can be early to a trend change, but because they have deep pockets, can hold an adverse position longer than Small or Large speculators. Most of the time, following the Commercials will give an alert of a coming trend change and may not be able to identify the specific time of a turn. The one-year S&P 500 futures chart illustrates the typical trading pattern of the Commercials. As a market rallies, they reduce long positions and increase short positions until they are net short. Large net short positions usually occur near market peaks. The situation is reversed in falling markets. Note the large long positions in October and February. Now look at the situation in late August; this is the largest short position for the Commercials in over a year. What's particularly interesting is that during the late August decline they chased prices and increased the short position. This is a clue that they may have a strong conviction about what could be coming soon for stocks. |
|
| Figure 2. The Commercials are the group you want to follow. They have the most money and are the most informed. |
| Graphic provided by: Barcharts.com. |
| |
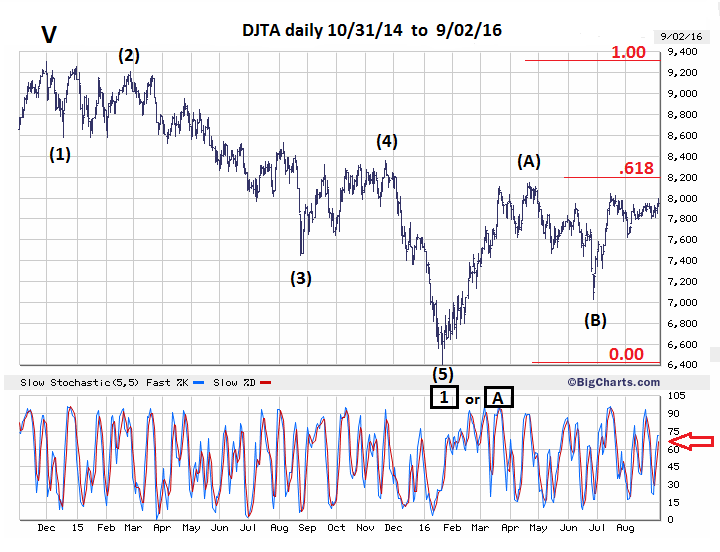
| Dow Jones Transportation Average Please see the daily Dow Jones Transportation Average (DJTA) chart illustrated in Figure 3. The DJTA all-time high came on November 28, 2014 at 9310.22, then went into a 13-month decline in an Elliott five wave pattern into the bottom at 6403.31. The subsequent rally appears to be taking the form of an A-B-C correction. If wave "C" up is under construction all that is needed for confirmation would be to move one tick above the supposed wave "A" at DJTA 8149.00. Major resistance is at 8199.78, which represents a .618 retrace of the entire decline from November 2014 to January 2016. If the DJTA makes a high in the area of 8149.01 to 8200 it could come at, or near, the same time of a SPX major peak. If the DJTA does turn down from the .618 resistance area, a retracement at least back to DJTA 6403.31 is possible. |
|
| Figure 3. DJTA Daily Chart. Major resistance is at 8199.78, which represents a .618 retrace of the entire decline from November 2014 to January 2016. |
| Graphic provided by: BigCharts.com. |
| |
| Summary And Strategy With Commercials taking a large short position on stocks at a seasonally bearish time while the SPX and DJTA are near important resistance the probabilities that a significant stock decline could begin very soon have increased. How significant of a decline? That depends if the SPX can reach a new 2016 high within the next two weeks. Raise the stop loss for half of long positions from SPX 2120 to SPX 2156. If the SPX moves above 2193 increase short positions to 25% and raise the stop loss from 2210 to 2235. A historic stock market peak could be made in September 2016. October is notorious for historic declines; perhaps another is due this year. Further Reading: Frost A.J and Robert Prechter (1985) "Elliott Wave Principle", New Classics Library. |
Independent investment advisor, trader and writer. He has written articles for Technical Analysis of Stocks & Commodities, Traders.com Advantage,Futuresmag.com and, Finance Magnates. Author of website Four Dimension Trading.
| Website: | www.fourdimensiontrading.com |
| E-mail address: | markrivest@gmail.com |
Click here for more information about our publications!
Comments

Request Information From Our Sponsors
- StockCharts.com, Inc.
- Candle Patterns
- Candlestick Charting Explained
- Intermarket Technical Analysis
- John Murphy on Chart Analysis
- John Murphy's Chart Pattern Recognition
- John Murphy's Market Message
- MurphyExplainsMarketAnalysis-Intermarket Analysis
- MurphyExplainsMarketAnalysis-Visual Analysis
- StockCharts.com
- Technical Analysis of the Financial Markets
- The Visual Investor
- VectorVest, Inc.
- Executive Premier Workshop
- One-Day Options Course
- OptionsPro
- Retirement Income Workshop
- Sure-Fire Trading Systems (VectorVest, Inc.)
- Trading as a Business Workshop
- VectorVest 7 EOD
- VectorVest 7 RealTime/IntraDay
- VectorVest AutoTester
- VectorVest Educational Services
- VectorVest OnLine
- VectorVest Options Analyzer
- VectorVest ProGraphics v6.0
- VectorVest ProTrader 7
- VectorVest RealTime Derby Tool
- VectorVest Simulator
- VectorVest Variator
- VectorVest Watchdog