HOT TOPICS LIST
- MACD
- Fibonacci
- RSI
- Gann
- ADXR
- Stochastics
- Volume
- Triangles
- Futures
- Cycles
- Volatility
- ZIGZAG
- MESA
- Retracement
- Aroon
INDICATORS LIST
LIST OF TOPICS
PRINT THIS ARTICLE
by Mark Rivest
See why September 1, 2016 could be a bottom for US stocks.
Position: N/A
Mark Rivest
Independent investment advisor, trader and writer. He has written articles for Technical Analysis of Stocks & Commodities, Traders.com Advantage,Futuresmag.com and, Finance Magnates. Author of website Four Dimension Trading.
PRINT THIS ARTICLE
FIBONACCI
Stock Market Lessons From Mr. Fibonacci
08/29/16 03:35:27 PMby Mark Rivest
See why September 1, 2016 could be a bottom for US stocks.
Position: N/A
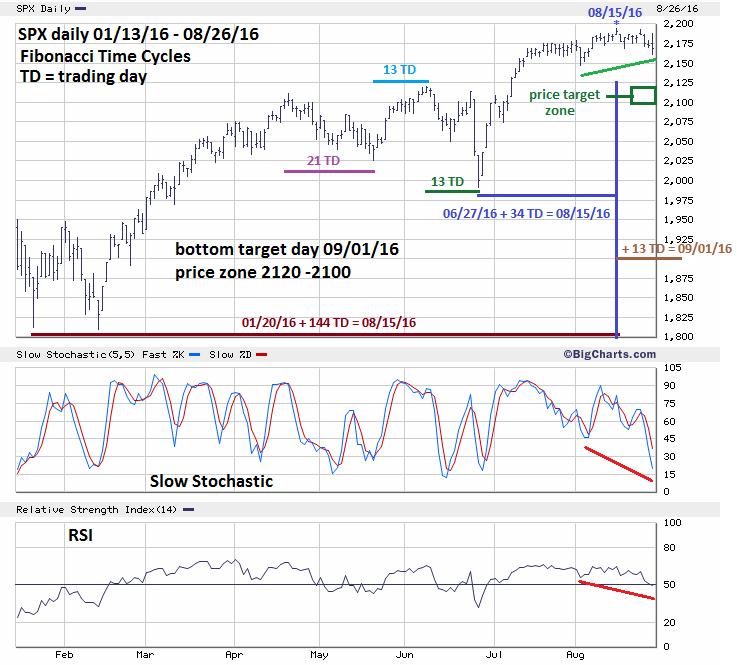
| For the last three weeks the activity of the US stock market can be summed up by a quote from that great American cartoon character/philosopher Homer Simpson — "Boring!" Things changed dramatically on August 26th, which was a day of wild fluctuations and a break below important short term support. Evidence indicates this could be the start of a sharp decline bringing the S&P 500 (SPX) to the 2115 area on September 1, 2016. Fibonacci Price And Time Targets In my July 8th article "The Brexit Factor - Part Two" I noted that since April 20th the SPX has been moving in time segments related to the Fibonacci sequence (1, 1, 2, 3, 5, 8, 13, 21, 34, 55, 89, 144, 233, to infinity). Please see the daily SPX chart illustrated in Figure 1. This is what's happened so far: - The April 20th peak plus 21 trading days targets the May 19th bottom. - The May 19th bottom plus 13 trading days targets the June 8th peak. - The June 8th peak plus 13 trading days targets the June 27th bottom. - The June 27th bottom plus 34 trading days targets the August 15th peak. Additionally, there is another Fibonacci time coordinate from the January 20th bottom plus 144 trading days' targets August 15. This is mind boggling! Four consecutive Fibonacci time turns; we're on a roll so we need to take a close look at September 1st which is 13 trading days after August 15. September 1st also happens to be a new moon and markets will occasionally turn on either full or new moons. In the price dimension my last article "S&P 500 Near A Ceiling" noted that the SPX had gotten very close to an important Fibonacci resistance point at 2183.53, and to allow for leeway to perhaps 2193. The peak on August 15th was 2193.81 with a test on August 23rd at 2193.42. I also noted that perhaps the Dow Jones Industrial Average (DJIA) may need to reach its equivalent to the SPX Fibonacci resistance, that level is DJIA 18,742. The DJIA August 15th peak was 18,722. Finally, I mention that the NASDAQ may need to reach its 2015 high of 5231 to achieve a Fibonacci ratio of 1/1 equality, where the 2016 rally equals the 2015/2016 bear market. This target was reached on August 15th and on August 23rd NASDAQ went marginally higher which was unconfirmed by both the SPX and DJIA. All three main US stock indices have reached important resistance areas. As for downside targets, the SPX high is 2193.81 - 1991.68 Brexit bottom = 202.13 x .382 = 77.21. 2193.81 - 77.21 = SPX 2116.60. SPX 2193.81 - 1810.10 February 11th bottom = 383.71 x .236 = 90.55. 2193.81 - 90.55 = 2103.26. With leeway the broad target zone is 2120 to 2100. In the momentum dimension both the daily RSI and Slow Stochastic have moved below the levels they reached on August 2nd while price is still above the August 2nd minor low. This predicts that price could move below the August 2nd bottom. Also note that both indicators are still not at levels that would signal the SPX is oversold. |

|
| Figure 1. SPX Daily Chart. This is mind boggling! Four consecutive Fibonacci time turns. |
| Graphic provided by: BigCharts.com. |
| |
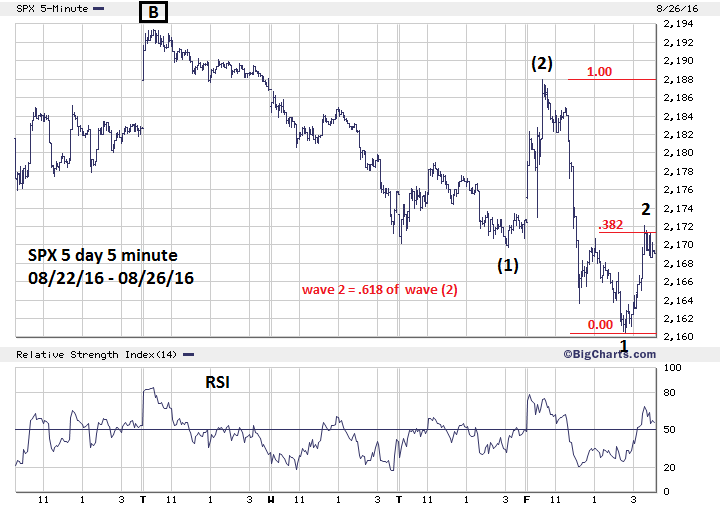
| SPX Intraday Pattern Please see the SPX 5 minute 5-day chart illustrated in Figure 2. On August 26th something very dramatic happened. At 10 AM EDT Fed chair Janet Yellen's speech was released. The SPX fell for 1 minute then rallied an incredible 14 points in just 20 minutes! It looked as if the bulls were in total control and would probably make a run at a new all-time high. Then the bears came back with a vengeance wiping out the entire rally and breaking below an important double bottom in the 2169 area. This dramatic reversal indicates a powerful shift in sentiment from bull to bear opening the door for more downside. Also note the late day rally into SPX 2172. There are four short term Fibonacci coordinates in the area of 2171 - 2173, I've illustrated the two main points. The first coordinate is that the late rally retraced near .382 of the decline from the high of the day. The second coordinate is that the supposed wave "2" is .618 of the supposed wave "(2)". These points represent powerful resistance implying that Monday August 29th could be a down day. How big of a down day? Elliott wave patterns may have the answer. |

|
| Figure 2: SPX 5-min Chart. There are four short term Fibonacci coordinates in the area of 2171–2173. |
| Graphic provided by: BigCharts.com. |
| |
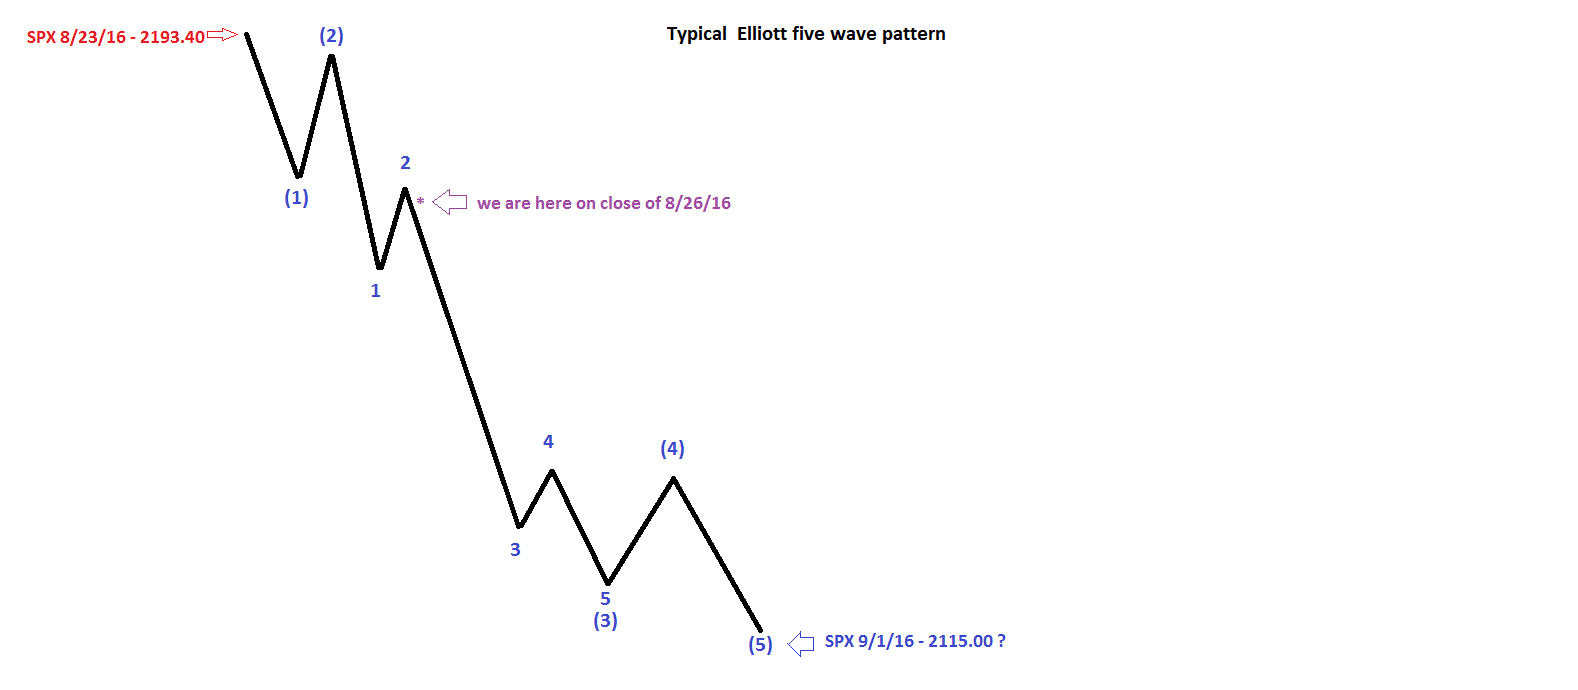
| Elliott Five Wave Pattern Please see the illustrated Elliott wave pattern in Figure 3. In a typical Elliott five wave pattern, waves "1" and "5" are usually either equal or related by the .618 Fibonacci ratio. Most of the time, especially in the stock market, wave "3" is the longest and many times you will be able to see the five sub waves of wave "3". This is what's illustrated in Figure 3. What's happened in the SPX since the August 23rd peak could be what's referred to as a series of one's and two's to the downside and is a very bearish configuration. If so, then the late day rally on August 26th could be the second wave "two" and the SPX is on the verge of a very steep decline. Examining the size of the two supposed waves "one's" down from August 23rd, a very large wave "three" down could easily reach the price target zone of 2120-2100 on or before the target date of September 1st. |

|
| Figure 3. Most of the time, especially in the stock market, wave "3" is the longest. |
| Graphic provided by: Mark Rivest. |
| |
| Strategy And Summary Maintain the stop loss for half of long positions at SPX 2120. While there could be a bottom near this area there is no way to know if that bottom will hold and it's better to be safe than sorry. If later it appears that a sustainable bottom is in place long positions can be reestablished. There are several indications from the dimensions of time, price, and momentum that a sharp stock market decline could be imminent. We should heed these signals and the lessons from Mr. Fibonacci. Further Reading: Frost A.J and Robert Prechter (1985) "Elliott Wave Principle", New Classics Library. |
Independent investment advisor, trader and writer. He has written articles for Technical Analysis of Stocks & Commodities, Traders.com Advantage,Futuresmag.com and, Finance Magnates. Author of website Four Dimension Trading.
| Website: | www.fourdimensiontrading.com |
| E-mail address: | markrivest@gmail.com |
Click here for more information about our publications!
Comments
Date: 08/30/16Rank: 5Comment:
Date: 10/29/16Rank: 5Comment: Very useful article! I am always very enjoying to read Mark s articles.

Request Information From Our Sponsors
- VectorVest, Inc.
- Executive Premier Workshop
- One-Day Options Course
- OptionsPro
- Retirement Income Workshop
- Sure-Fire Trading Systems (VectorVest, Inc.)
- Trading as a Business Workshop
- VectorVest 7 EOD
- VectorVest 7 RealTime/IntraDay
- VectorVest AutoTester
- VectorVest Educational Services
- VectorVest OnLine
- VectorVest Options Analyzer
- VectorVest ProGraphics v6.0
- VectorVest ProTrader 7
- VectorVest RealTime Derby Tool
- VectorVest Simulator
- VectorVest Variator
- VectorVest Watchdog
- StockCharts.com, Inc.
- Candle Patterns
- Candlestick Charting Explained
- Intermarket Technical Analysis
- John Murphy on Chart Analysis
- John Murphy's Chart Pattern Recognition
- John Murphy's Market Message
- MurphyExplainsMarketAnalysis-Intermarket Analysis
- MurphyExplainsMarketAnalysis-Visual Analysis
- StockCharts.com
- Technical Analysis of the Financial Markets
- The Visual Investor
