

HOT TOPICS LIST
- MACD
- Fibonacci
- RSI
- Gann
- ADXR
- Stochastics
- Volume
- Triangles
- Futures
- Cycles
- Volatility
- ZIGZAG
- MESA
- Retracement
- Aroon
INDICATORS LIST
LIST OF TOPICS
PRINT THIS ARTICLE
by Mark Rivest
Technical analysis forecasted an S&P 500 bottom at 2000 on June 27, 2016. What are the indicators pointing to now?
Position: N/A
Mark Rivest
Independent investment advisor, trader and writer. He has written articles for Technical Analysis of Stocks & Commodities, Traders.com Advantage,Futuresmag.com and, Finance Magnates. Author of website Four Dimension Trading.
PRINT THIS ARTICLE
TECHNICAL ANALYSIS
The Brexit Factor - Part Two
07/08/16 01:36:57 PMby Mark Rivest
Technical analysis forecasted an S&P 500 bottom at 2000 on June 27, 2016. What are the indicators pointing to now?
Position: N/A
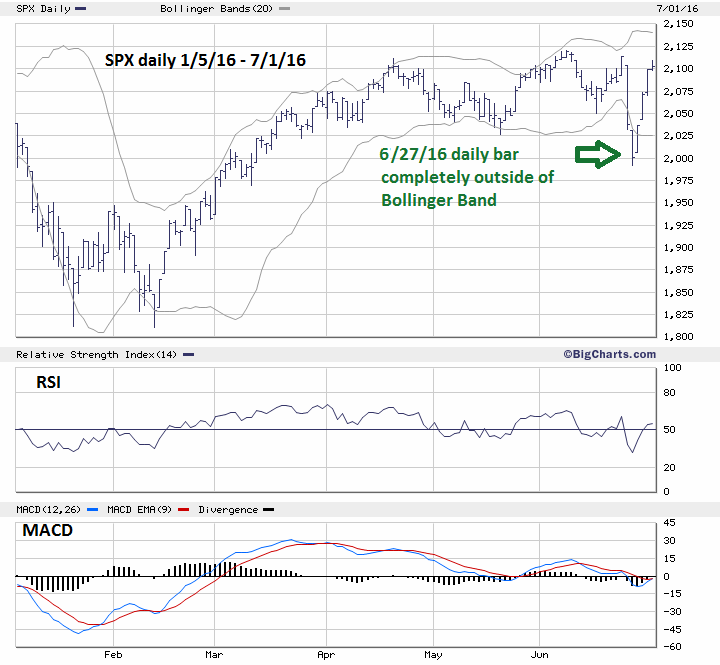
| In my June 15th article "Summer Solstice Buying Opportunity" I noted there was a cluster of Fibonacci coordinates near S&P 500 (SPX) 2000 as a zone of powerful support. The article also noted a Fibonacci time cycle targeted June 20th as a possible day when the bottom could be reached. My subsequent article "The Brexit Factor" reiterated that 2000 was important support and that June 27th was now the target date for a bottom. On Monday June 27, 2016 the SPX hit an intraday low of 1991.70 and closed at 2000.54! This is equivalent to golfs "Hole in one". The next day the SPX blasted up gaining 102 points in just four trading days! Traders utilizing the knowledge of a potential bottom at 2000 on June 27th were able to reap an abundant harvest of profits. Let's examine current technical indicators as to where the SPX could be trading in the next several weeks. Momentum Dimension Please see the daily SPX chart illustrated in Figure 1. Note that on June 27th the daily bar was completely outside of the lower Bollinger Band. This rarely happens and implies at least a short term bottom. The last time this phenomenon occurred was on the August 24, 2015 mini crash. That bottom held for five months. Also note that both the daily RSI and MACD are at their deepest oversold levels since the correction began on June 8th. Normally there could be the possibility that near term prices would go lower and set up a bullish divergence for both the RSI and MACD. In a panic situation such as what occurred on June 27th this is not necessary. Examine what happened with these indicators on August 24th. |
|
| Figure 1. The last time the SPX daily price bar went outside the lower Bollinger Band was the August 24, 2015 mini crash. |
| Graphic provided by: BigCharts.com. |
| |
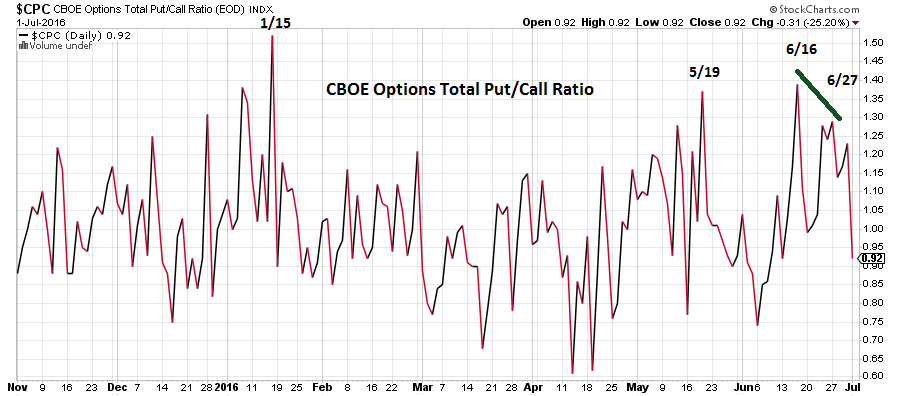
| Sentiment Dimension Please see the daily CBOE daily put/call chart illustrated in Figure 2. In "The Brexit Factor" article I noted that on June 16th the CBOE options Total Put/Call ratio hit 1.39 which was slightly higher than the 1.37 reading at the May 19th bottom. On June 27th, the Put/Call ratio reached only 1.29. Having lower prices with a lower Put/Call ratio is strong evidence that a sentiment shift is occurring — in this case indicating the bulls were about to take control. |
|
| Figure 2. On June 27th the Put/Call ratio reached only 1.29. |
| Graphic provided by: StockCharts.com. |
| |
| Time Dimension Several of my articles have shown a Fibonacci time forecasting technique in which either two market peaks or bottoms could be used to forecast the next market turning point. For example, there are two bottoms ten trading days apart. Multiplying 10 by 1.618 equals 16 then add 16 trading days to the second bottom targets the next potential market turn plus or minus two trading days. More about this technique can be found in Larry Williams book, "The Definitive Guide to Futures Trading". The technique that I used in my June 15th article is different and more accurate — at least on the daily scale — than the methodology described above. The SPX since the April 20th top has been moving in time segments related to the Fibonacci sequence.The Fibonacci sequence is as follows: 1, 1, 2, 3, 5, 8, 13, 21, 34, 55, 89, 144 to infinity. Adding 21 trading days to the April 20th top targets the May 19th bottom. Adding 13 trading days to the May 19th bottom targets the June 8th peak. Adding 13 trading days to the June 8th peak targets the June 27th bottom. When using this technique on a daily scale there is no leeway, either the target is hit or it's not. Hitting the target and the subsequent dramatic reversal implies the June 27th bottom could hold at least for several months. Also, the phenomenon of the SPX moving in time segments related to the Fibonacci sequence may not be complete. We may be able to catch the next SPX top using this method. |
| Price Dimension My June 15th article noted a tight cluster of three Fibonacci coordinates in the SPX 2000 area. Fibonacci coordinates are like magnets drawing markets toward them. If a market reaches a coordinate this then becomes a barrier. The more Fibonacci coordinates, the stronger the magnet and potential barrier. That the SPX reached this barrier and dramatically reversed course is evidence of powerful support that will probably hold for at least several months. One area of the price dimension that has changed since my June 15th article is the Elliott wave count. I originally stated that an Expanding Flat correction probably began at the April 20th peak. This count, while as of July 1st, has not been eliminated, but it is now a very low probability. There are several alternative counts that could be in effect but it's too early to determine which count has the highest probability. |
| Summary First, a quick update on the Shanghai composite. In several articles I've stated that this stock index is one of the weakest in the world. During the Brexit decline this index went down very little compared to the other stock indices around the world. This puts the Ending Diagonal Triangle wave count I've noted in doubt. I'll return to this index in a future article after the wave count clears up. As for the US stock market, whenever there's evidence in each of the four market dimensions indicating a market turn, the subsequent move usually lasts several months. The June 8-27 decline is most likely a correction within an ongoing bull market. Raise the stop loss from SPX 1970 to 1991. If there is a pullback in the next two weeks use it as an opportunity to add on to long positions. Minimum upside SPX potential is 2200. Further Reading: Williams Larry (1988) "The Definitive Guide to Futures Trading", Windsor Books. |
Independent investment advisor, trader and writer. He has written articles for Technical Analysis of Stocks & Commodities, Traders.com Advantage,Futuresmag.com and, Finance Magnates. Author of website Four Dimension Trading.
| Website: | www.fourdimensiontrading.com |
| E-mail address: | markrivest@gmail.com |
Click here for more information about our publications!
PRINT THIS ARTICLE

Request Information From Our Sponsors
- VectorVest, Inc.
- Executive Premier Workshop
- One-Day Options Course
- OptionsPro
- Retirement Income Workshop
- Sure-Fire Trading Systems (VectorVest, Inc.)
- Trading as a Business Workshop
- VectorVest 7 EOD
- VectorVest 7 RealTime/IntraDay
- VectorVest AutoTester
- VectorVest Educational Services
- VectorVest OnLine
- VectorVest Options Analyzer
- VectorVest ProGraphics v6.0
- VectorVest ProTrader 7
- VectorVest RealTime Derby Tool
- VectorVest Simulator
- VectorVest Variator
- VectorVest Watchdog
- StockCharts.com, Inc.
- Candle Patterns
- Candlestick Charting Explained
- Intermarket Technical Analysis
- John Murphy on Chart Analysis
- John Murphy's Chart Pattern Recognition
- John Murphy's Market Message
- MurphyExplainsMarketAnalysis-Intermarket Analysis
- MurphyExplainsMarketAnalysis-Visual Analysis
- StockCharts.com
- Technical Analysis of the Financial Markets
- The Visual Investor