

HOT TOPICS LIST
- MACD
- Fibonacci
- RSI
- Gann
- ADXR
- Stochastics
- Volume
- Triangles
- Futures
- Cycles
- Volatility
- ZIGZAG
- MESA
- Retracement
- Aroon
INDICATORS LIST
LIST OF TOPICS
PRINT THIS ARTICLE
by Mark Rivest
See why June 20, 2016 could be a great time to buy stocks.
Position: N/A
Mark Rivest
Independent investment advisor, trader and writer. He has written articles for Technical Analysis of Stocks & Commodities, Traders.com Advantage,Futuresmag.com and, Finance Magnates. Author of website Four Dimension Trading.
PRINT THIS ARTICLE
ELLIOTT WAVE
Summer Solstice Buying Opportunity
06/15/16 12:42:44 PMby Mark Rivest
See why June 20, 2016 could be a great time to buy stocks.
Position: N/A
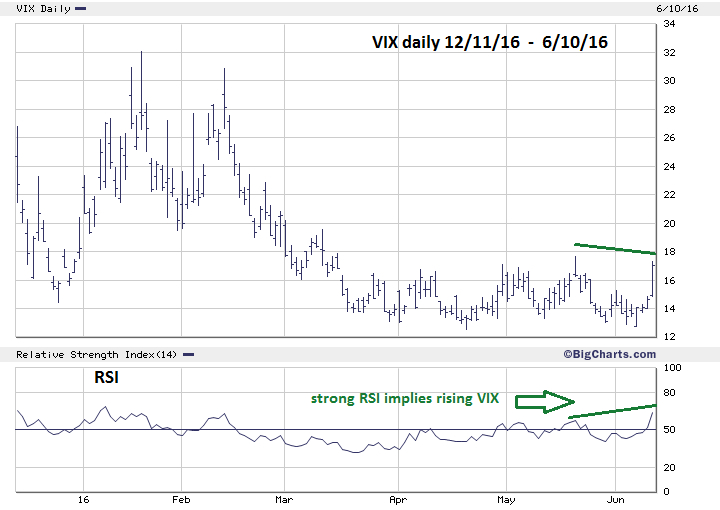
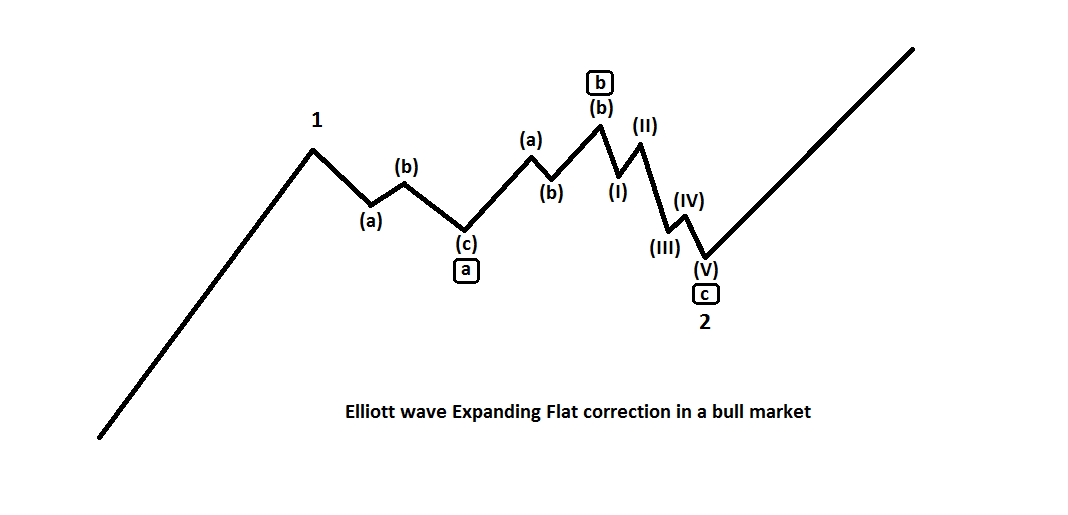
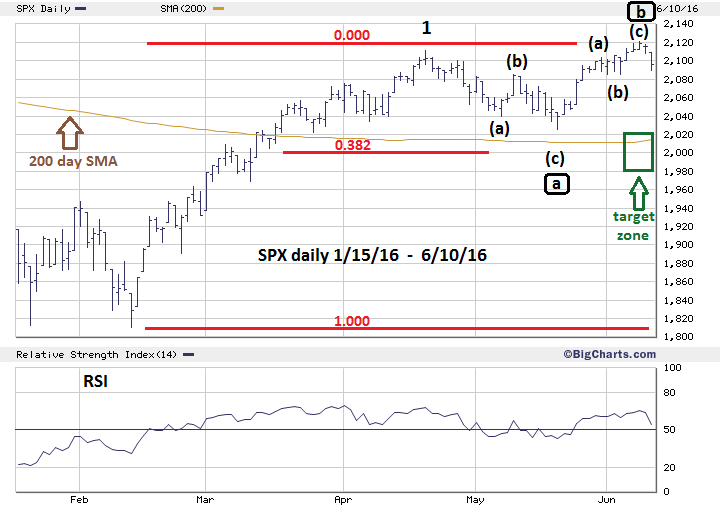
| My previous article "Fake Out Break Out" noted that as of May 27th the S&P 500 (SPX) was nearing a resistance zone, and that the daily stochastic was in the overbought zone. A recommendation was given to add to long stock positions if the SPX declined in early June. Subsequently in the next seven trading days the SPX climbed another twenty points, and as of June 8th, the rally appears to be complete. The next decline could be sharp and provide a great opportunity to buy stocks on or near June 20th. SPX Price Dimension The June 10th SPX decline caused the VIX to increase 16%. Please see the VIX daily chart illustrated in Figure 1. This powerful move strongly implies that the SPX has begun a decline that could be larger than the April 20 - May 19 drop. The SPX rally from May 19 - June 8 so far counts as three waves. If so, an Elliott wave Expanding Flat could be under construction. Please see the Expanding Flat correction illustrated in Figure 2. In this particular pattern the initial three wave decline is followed by a three wave rally that exceeds the point of origin of the decline. The subsequent third phase of the pattern then declines in five waves and usually terminates below the end point of the first decline. Please see the daily SPX chart illustrated in Figure 3. There are usually Fibonacci relationships between the sub waves of Expanding Flats. The first step is to determine the most significant retracement level of the February to June rally which is .382 at SPX 2001.96. Next, determine if the supposed wave "c" of the Expanding Flat has a Fibonacci relationship to wave "a". In this case, wave "a" (the April 20 - May 19 decline) was 85.14 points multiplied by 1.382 equals 117.66 points. The supposed wave "b" peak is 2120.55; subtracting 117.66 from this peak targets SPX 2002.89 — only .93 points from the first coordinate. Then determine if there's a relationship between wave "b" and "c". The May 19 - June 8 rally is 94.64 points, multiplied by 1.236 equals 116.97 points. The June 8th peak at 2120.55 - 116.97 = 2003.58; amazingly close to the other two coordinates. Fibonacci coordinates act as magnets drawing markets towards them. After a market reaches a coordinate it acts as a barrier. The more Fibonacci coordinates there are the stronger the barrier. The SPX 2000 area is a zone of powerful support. Also note the SPX 200-day simple moving average (SMA) as of June 10th is near the SPX 2015 level. If the SPX were to decline it would probably move the line to around 2000. Fund managers could be buying around the SMA if the SPX were to get near the line. |
|
| Figure 1. VIX Daily. The June 10th SPX decline caused the VIX to increase 16%. |
| Graphic provided by: BigCharts.com. |
| |
| SPX Time Dimension The sub waves of the supposed Expanding Flat since April 20th have so far been moving in time segments related to the Fibonacci sequence. The Fibonacci sequence is as follows. 1, 1 ,2, 3, 5, 8, 13 ,21, 34, 55, 89, 144 to infinity. Adding 21 trading days to the April 20th top targets May 19th, which was the supposed wave "a" termination point. Adding 13 trading days to May 19th targets June 8th which appears to be the termination point of wave "b" of the Expanding Flat. The next lower number in the Fibonacci sequence is 8. Adding 8 trading days to June 8th targets June 20, 2016, which is the Summer Solstice and the occurrence of a full moon. Recall that the Thursday, May 19th bottom was only two calendar days before a full moon. |
|
| Figure 2. Elliott Wave Expanding Flat Pattern. In this particular pattern the initial three wave decline is followed by a three wave rally that exceeds the point of origin of the decline. |
| Graphic provided by: Mark Rivest. |
| |
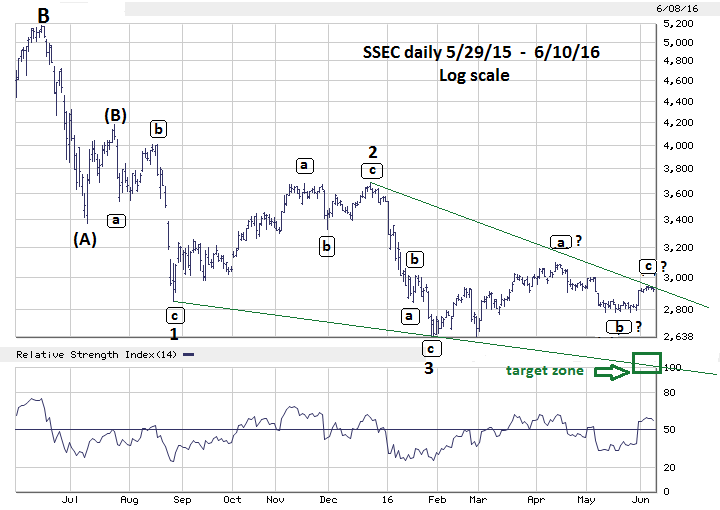
| Shanghai Composite Update Please see the daily Shanghai composite (SSEC) chart in Figure 4. The SSEC continues to have the possibility of forming an Elliott wave Ending Diagonal Triangle (EDT) from the peak made in July 2015. The supposed wave "4" of the EDT could be forming a Horizontal Triangle. If so, that structure is nearly complete, making the SSEC vulnerable to a sharp decline that could tie-in with an SPX decline. Because EDT patterns usually touch or exceed the trend-line that connects waves "1" and "3", the target zone for EDT termination is being lowered to 2400 - 2500. If the SPX does make an important bottom on June 20th the SSEC being the weaker index would probably bottom a few days after the SPX. |
|
| Figure 3. SPX Daily. The SPX 2000 area is a zone of powerful support. |
| Graphic provided by: BigCharts.com. |
| |
| Strategy My June 8th article recommended repositioning proceeds from defensive liquidations made in May. Use mid-June as the new time zone to buy and lower the stop sell level on repositioned long positions to SPX 1970. The bulls-eye time zone to buy is June 20th with a leeway of plus or minus two trading days. If the SPX can hit the price/time targets, it could be a hot, sizzling and profitable summer for the bulls. Further Reading: Frost A.J and Robert Prechter (1985) "Elliott Wave Principle", New Classics Library. |
|
| Figure 4. SSEC Daily. The SSEC continues to have the possibility of forming an Elliott wave Ending Diagonal Triangle. |
| Graphic provided by: BigCharts.com. |
| |
Independent investment advisor, trader and writer. He has written articles for Technical Analysis of Stocks & Commodities, Traders.com Advantage,Futuresmag.com and, Finance Magnates. Author of website Four Dimension Trading.
| Website: | www.fourdimensiontrading.com |
| E-mail address: | markrivest@gmail.com |
Click here for more information about our publications!
Comments
Date:�06/16/16Rank:�1Comment:�

Request Information From Our Sponsors
- StockCharts.com, Inc.
- Candle Patterns
- Candlestick Charting Explained
- Intermarket Technical Analysis
- John Murphy on Chart Analysis
- John Murphy's Chart Pattern Recognition
- John Murphy's Market Message
- MurphyExplainsMarketAnalysis-Intermarket Analysis
- MurphyExplainsMarketAnalysis-Visual Analysis
- StockCharts.com
- Technical Analysis of the Financial Markets
- The Visual Investor
- VectorVest, Inc.
- Executive Premier Workshop
- One-Day Options Course
- OptionsPro
- Retirement Income Workshop
- Sure-Fire Trading Systems (VectorVest, Inc.)
- Trading as a Business Workshop
- VectorVest 7 EOD
- VectorVest 7 RealTime/IntraDay
- VectorVest AutoTester
- VectorVest Educational Services
- VectorVest OnLine
- VectorVest Options Analyzer
- VectorVest ProGraphics v6.0
- VectorVest ProTrader 7
- VectorVest RealTime Derby Tool
- VectorVest Simulator
- VectorVest Variator
- VectorVest Watchdog