

HOT TOPICS LIST
- MACD
- Fibonacci
- RSI
- Gann
- ADXR
- Stochastics
- Volume
- Triangles
- Futures
- Cycles
- Volatility
- ZIGZAG
- MESA
- Retracement
- Aroon
INDICATORS LIST
LIST OF TOPICS
PRINT THIS ARTICLE
by Mark Rivest
See why the May 19th bottom could lead to new all-time highs for the S&P 500.
Position: N/A
Mark Rivest
Independent investment advisor, trader and writer. He has written articles for Technical Analysis of Stocks & Commodities, Traders.com Advantage,Futuresmag.com and, Finance Magnates. Author of website Four Dimension Trading.
PRINT THIS ARTICLE
FALSE MOVES
Break Out, Fake Out
06/08/16 03:59:54 PMby Mark Rivest
See why the May 19th bottom could lead to new all-time highs for the S&P 500.
Position: N/A
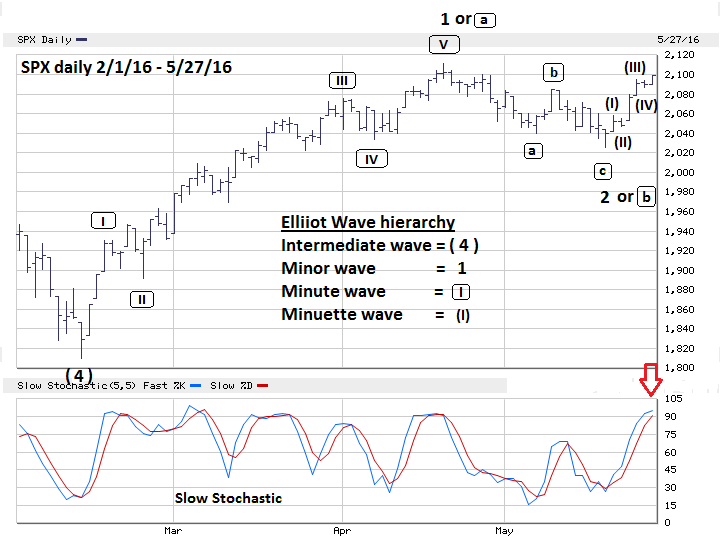
| My May 19th article "S&P 500 At The Crossroads" noted that there was an important support zone in the S&P 500 (SPX) area of 2030-2050. On May 19th the SPX broke below 2030, fell to 2025, and then began a new rally. The break out below support was a fake out, the subsequent rally could be the first wave up on the road to new all-time highs. Let's examine the evidence that points to the SPX reaching 2200 or 2300 later in 2016. S&P 500 There were three Fibonacci coordinate at SPX 2045.64, 2041.88, and 2040.03; normally a tight cluster of Fibonacci points represents a powerful barrier and would take a powerful move to breach that barrier. On May 19th the SPX breached the cluster and the lower leeway cushion at 2030. Most of the time a break of strong support would lead to a strong move down, most of the time does not mean all of the time, however. Markets can turn at any point and the SPX bottom on May 19th came at what I call "the no Fib zone". This is an area where there are no significant Fibonacci points. In spite of this fake out, the SPX quickly gave clues the bulls were still in control. First, on May 19th the SPX bottomed only five points below the lower end of support and then rallied fifteen points into the close. On May 20th the SPX rallied another sixteen points and closed up twelve points. May 20th was a very important day — the bears had a chance to follow through on the May 19th break out and couldn't. Please see the daily SPX chart illustrated in Figure 1. The clearest indication that the bulls are in control of the stock market is the SPX decline from the April 20th top to the May 19th bottom vs. the rally after May 19th. At the secondary peak on April 27th the SPX high was 2099.89, and closed at 2095.15. From there it took sixteen trading days to complete the decline. After May 19th it took only six trading days to reach 2099.06. The path of least resistance is to the upside. Also note the choppy characteristic of the April 20-May 19 decline which is typical of corrections in bull markets. The rally from the May 19th bottom appears to be a very clear Elliott five wave impulse pattern. The CBOE options total put/call ratio on May 19th reached 1.37 the highest level since a January 15th reading of 1.52, only two trading days before the January 20th penultimate bottom. There was a full moon on Saturday, May 21st, and significant market turns will occasionally occur near full/new moons. The May 19th bottom at 2025.91 could be wave "2" of a five wave up pattern forming from the SPX February 11th bottom at 1810.10. The supposed wave "1" which peaked at 2111.05 was 300.95 SPX points. If the next wave up equals wave "1" then 2025.91 + 300.95 = 2326.86 as a possible, wave "3" peak. An alternate calculation in which wave "3" is .618 of wave "1" targets SPX 2211.89 as a possible top. |
|
| Figure 1. SPX Daily Chart. The rally from the May 19th bottom appears to be a very clear Elliott five wave impulse pattern. |
| Graphic provided by: BigCharts.com. |
| |
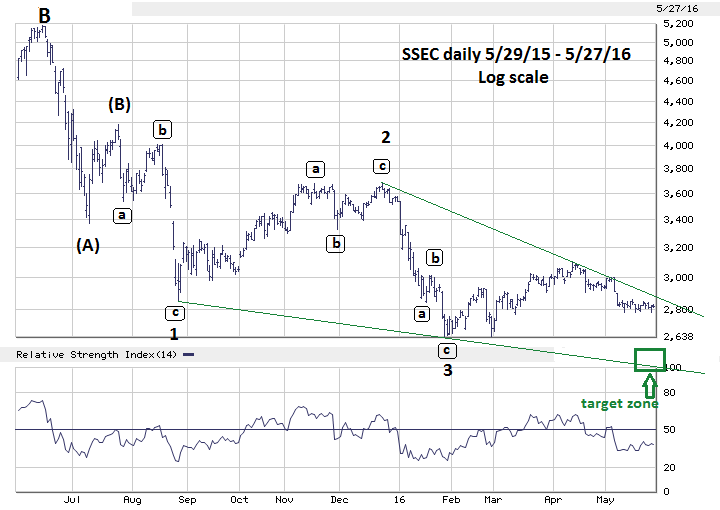
| Shanghai Composite The Shanghai composite (SSEC) continues to have the possibility of forming an Elliott wave Ending Diagonal Triangle (EDT) from the peak made in July 2015. Please see the daily SSEC chart illustrated in Figure 2. The target zone for EDT completion remains in the 2440-2540 area. Pay attention if prices near the lower descending trend line that connects the termination points of the supposed waves "1" and "3". If the SSEC does complete the EDT pattern it has bullish implications for stock indices worldwide. |
|
| Figure 2. SSEC Daily Chart. If the SSEC does complete the EDT pattern it has bullish implications for stock indices worldwide. |
| Graphic provided by: BigCharts.com. |
| |
| Strategy At the close on May 27th the SPX was nearing resistance at the April 20th top of 2111.05. Also the daily Slow Stochastic was in the overbought zone. My May 19th article recommended liquidating half of all long positions if the SPX broke below 2030. If the SPX goes into another decline in early June, incrementally reposition those proceeds back into long stock positions. Use the SPX bottom at 2025.91 as the stop loss point for the repositioned long positions. If the SPX goes into a short term decline in early June and holds above 2025.91 a very bullish Elliott wave pattern could be in place. If the SSEC can also complete the EDT pattern, summer 2016 could be a great time to be holding long stock positions. Further Reading: Frost A.J and Robert Prechter (1985) "Elliott Wave Principle", New Classics Library. |
Independent investment advisor, trader and writer. He has written articles for Technical Analysis of Stocks & Commodities, Traders.com Advantage,Futuresmag.com and, Finance Magnates. Author of website Four Dimension Trading.
| Website: | www.fourdimensiontrading.com |
| E-mail address: | markrivest@gmail.com |
Click here for more information about our publications!
PRINT THIS ARTICLE

Request Information From Our Sponsors
- StockCharts.com, Inc.
- Candle Patterns
- Candlestick Charting Explained
- Intermarket Technical Analysis
- John Murphy on Chart Analysis
- John Murphy's Chart Pattern Recognition
- John Murphy's Market Message
- MurphyExplainsMarketAnalysis-Intermarket Analysis
- MurphyExplainsMarketAnalysis-Visual Analysis
- StockCharts.com
- Technical Analysis of the Financial Markets
- The Visual Investor
- VectorVest, Inc.
- Executive Premier Workshop
- One-Day Options Course
- OptionsPro
- Retirement Income Workshop
- Sure-Fire Trading Systems (VectorVest, Inc.)
- Trading as a Business Workshop
- VectorVest 7 EOD
- VectorVest 7 RealTime/IntraDay
- VectorVest AutoTester
- VectorVest Educational Services
- VectorVest OnLine
- VectorVest Options Analyzer
- VectorVest ProGraphics v6.0
- VectorVest ProTrader 7
- VectorVest RealTime Derby Tool
- VectorVest Simulator
- VectorVest Variator
- VectorVest Watchdog