

HOT TOPICS LIST
- MACD
- Fibonacci
- RSI
- Gann
- ADXR
- Stochastics
- Volume
- Triangles
- Futures
- Cycles
- Volatility
- ZIGZAG
- MESA
- Retracement
- Aroon
INDICATORS LIST
LIST OF TOPICS
PRINT THIS ARTICLE
by Mark Rivest
Will important support hold? The Fibonacci .236 retrace level for the S&P 500 (SPX) February-to-April rally is at 2040.03. On May 6th, the SPX hit 2039.45 and proceeded to rally for three days. As of the close on May 13th that rally has been almost completely retraced, will the support zone in the area of SPX 2040 hold? If not, where is the next important support zone? As of mid-May 2016, the SPX is at a decision point and could either resume the rally from February 11th or continue the decline from the April 20th top. Let's examine the evidence.
Position: N/A
Mark Rivest
Independent investment advisor, trader and writer. He has written articles for Technical Analysis of Stocks & Commodities, Traders.com Advantage,Futuresmag.com and, Finance Magnates. Author of website Four Dimension Trading.
PRINT THIS ARTICLE
FIBONACCI
S&P 500 At The Crossroads
05/19/16 04:39:14 PMby Mark Rivest
Will important support hold? The Fibonacci .236 retrace level for the S&P 500 (SPX) February-to-April rally is at 2040.03. On May 6th, the SPX hit 2039.45 and proceeded to rally for three days. As of the close on May 13th that rally has been almost completely retraced, will the support zone in the area of SPX 2040 hold? If not, where is the next important support zone? As of mid-May 2016, the SPX is at a decision point and could either resume the rally from February 11th or continue the decline from the April 20th top. Let's examine the evidence.
Position: N/A
| S & P 500 Daily Time is the most important factor in favor of the bears. In seven of the last ten years, the SPX has begun significant declines in the April to May time zone. Five of the seven peaks were in May. In 2010, the peak came on April 26th and was only 14 points above the May 3rd top. In 2012, the peak was on April 2nd while the subsequent retest of that high was on May 1st and missed making a new high by only 7 points. This year the peak was on April 20th with, assuming it holds, a retest on May 10th only 25 points lower. In my prior article "Buy in May and Stay" the SPX support zone was identified as 2030-2050 and was based upon three close coordinates. The first being the .236 retrace at 2040.03; the second is chart support at 2041.88; the third at 2045.64 based on short term price movements since April 20th. Please see the daily SPX chart illustrated in Figure 1. This chart is an update of the daily SPX chart illustrated in my prior article. Note that the daily Slow Stochastic entered the oversold zone just as the SPX hit support in the 2040 area. Also note the Slow Stochastic, as of May 13th, is not near the oversold zone. This is another piece of evidence that favors the bears and could be a clue that the lower end of the support zone at 2030 could be breached in a few days. |
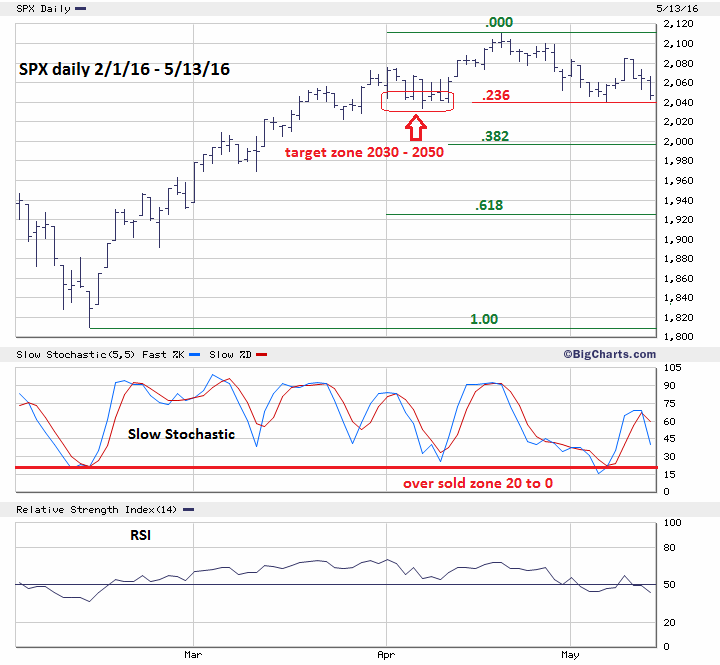
|
| Figure 1. Slow Stochastic as of May 13th is not near the oversold zone. |
| Graphic provided by: BigCharts.com. |
| |
| S&P 500 Intraday Evidence that favors the bulls is the pattern of the decline from April 20-May 6. Note on the daily SPX chart that the rallies of May 2nd and May 5th overlap the bottoms of the prior declines. This choppiness is a characteristic of corrective patterns as the bears struggle to make new lows. Please see the intraday SPX chart illustrated in Figure 2. The SPX from the April 20th peak appears to be forming an Elliott wave Double Zigzag correction. The second Zigzag down begins at the 2084.86 peak labeled as wave "x". The supposed wave "(a)" 2084.86 - 2053.19 = 31.67. The supposed wave "(b)" is 2070.77 - 31.67 = 2039.10 as the target for the supposed wave "(c)" and the termination point for the entire Double Zigzag structure from the April 20th top. The target price of 2039.10 is amazingly close to the most current low at 2039.48. |
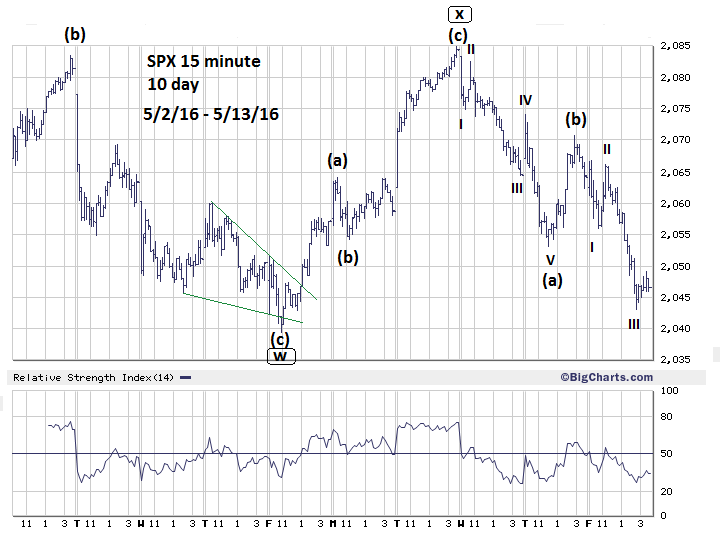
|
| Figure 2. The SPX from the April 20th peak appears to be forming an Elliott wave Double Zigzag correction. |
| Graphic provided by: BigCharts.com. |
| |
| Shanghai Composite Update My April 27th article "Shanghai Surprise" illustrated that the Shanghai Composite (SSEC) could be forming an Elliott wave Ending Diagonal Triangle (EDT) from its July 2015 top. This pattern has bullish implications for stock indices worldwide. Since mid-2015 the SSEC has been one of the weakest stock indexes in the world. If the SSEC is forming an EDT, the subsequent rally after its completion could result in a rally that lasts from two to four months. Most if not all other stock indices would likely follow in its wake. Please see the daily SSEC chart illustrated in Figure 3. This is an update to the SSEC chart shown in my May 9th article. The target zone for the EDT bottom remains 2440-2540. A change has been made as to the status of the supposed wave "4" of the EDT. It's possible that wave "4" could still be under construction, which explains why the supposed wave "5" of the EDT was taking so much time relative to waves "1" and "3" of the EDT. Because of the uncertainty of the wave count as of May 13th, it's not possible to calculate a time target for the EDT bottom. If, however, the SSEC can reach 2440-2540 anytime in the next two weeks there is a very good chance this would mark the end of the EDT. Pay close attention to the lower trendline, especially if there is a price break below the line which is typical of an EDT climax. See the intraday SPX chart in illustration 2 for an example of an EDT termination — labeled wave "w". |
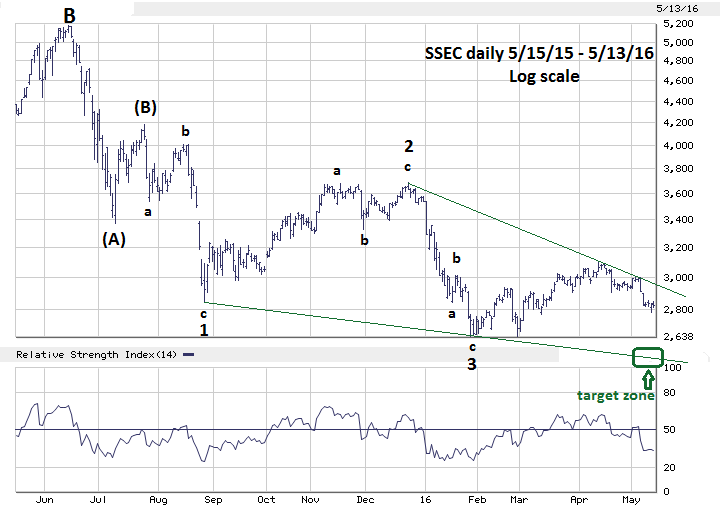
|
| Figure 3. This pattern has bullish implications for stock indices worldwide. |
| Graphic provided by: BigCharts.com. |
| |
| Strategy The tight cluster of Fibonacci points between SPX 2039 and 2045 is the strongest piece of evidence we have. It creates a very powerful support zone and would take a very powerful move down to break that support. Normally, when a market breaks a Fibonacci barrier it will gravitate to the next Fibonacci barrier, which in this case is SPX 1996.08 a .382 retrace of the February-April rally. However, a powerful move below the lower end of the support zone at 2030 could trigger a rapid move to SPX 1925.07 the .618 retracement of the February-April rally. |
| If a breakthrough of SPX 2030 is to occur it could come as soon as the week of May 16-20. Liquidate half of all long positions if the SPX moves below 2030. "Uncertainty" in regards to the markets is a cliche which is bandied about far too often. There is always uncertainty in any market. The successful traders recognize this and prepare for changes regardless of which direction a market decides to take. Further Reading: Frost A.J and Robert Prechter (1985) "Elliott Wave Principle", New Classics Library. |
Independent investment advisor, trader and writer. He has written articles for Technical Analysis of Stocks & Commodities, Traders.com Advantage,Futuresmag.com and, Finance Magnates. Author of website Four Dimension Trading.
| Website: | www.fourdimensiontrading.com |
| E-mail address: | markrivest@gmail.com |
Click here for more information about our publications!
Comments

Request Information From Our Sponsors
- VectorVest, Inc.
- Executive Premier Workshop
- One-Day Options Course
- OptionsPro
- Retirement Income Workshop
- Sure-Fire Trading Systems (VectorVest, Inc.)
- Trading as a Business Workshop
- VectorVest 7 EOD
- VectorVest 7 RealTime/IntraDay
- VectorVest AutoTester
- VectorVest Educational Services
- VectorVest OnLine
- VectorVest Options Analyzer
- VectorVest ProGraphics v6.0
- VectorVest ProTrader 7
- VectorVest RealTime Derby Tool
- VectorVest Simulator
- VectorVest Variator
- VectorVest Watchdog
- StockCharts.com, Inc.
- Candle Patterns
- Candlestick Charting Explained
- Intermarket Technical Analysis
- John Murphy on Chart Analysis
- John Murphy's Chart Pattern Recognition
- John Murphy's Market Message
- MurphyExplainsMarketAnalysis-Intermarket Analysis
- MurphyExplainsMarketAnalysis-Visual Analysis
- StockCharts.com
- Technical Analysis of the Financial Markets
- The Visual Investor