

HOT TOPICS LIST
- MACD
- Fibonacci
- RSI
- Gann
- ADXR
- Stochastics
- Volume
- Triangles
- Futures
- Cycles
- Volatility
- ZIGZAG
- MESA
- Retracement
- Aroon
INDICATORS LIST
LIST OF TOPICS
PRINT THIS ARTICLE
by Mark Rivest
The Shanghai Composite could be forming a pattern that points to an important bottom.
Position: N/A
Mark Rivest
Independent investment advisor, trader and writer. He has written articles for Technical Analysis of Stocks & Commodities, Traders.com Advantage,Futuresmag.com and, Finance Magnates. Author of website Four Dimension Trading.
PRINT THIS ARTICLE
ELLIOTT WAVE
Shanghai Surprise
04/27/16 01:15:48 PMby Mark Rivest
The Shanghai Composite could be forming a pattern that points to an important bottom.
Position: N/A
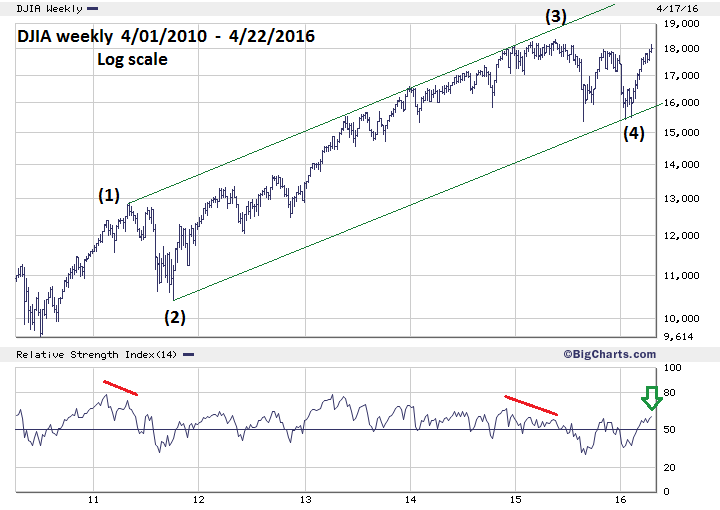
| Since the bottom made on February 11, 2016, the main US stock indices have been in a relentless rally as the bulls have pushed through several resistance zones. On April 20th the Dow Jones Industrial Average (DJIA) was only 1% away from making a new all-time high, at the same time clues appeared that hinted a decline could begin soon. The Shanghai Composite (SSEC) may provide the strongest evidence as to the direction of stocks not only in China but for stock indices worldwide. DJIA Review — Long Term Please see the illustrated weekly DJIA chart in Figure 1. Since the bottom made in 2010, the DJIA appears to be forming a five wave Elliott impulse pattern, the current rally from the 2016 bottoms is the fifth wave of the structure. Adding evidence to this theory is the nearly perfect parallel trend channel from the 2011 high and low. If a standard Elliott impulse wave is forming from 2010, we would expect at a bare minimum for the DJIA to reach a marginal new all-time high. Note how in 2011 and 2015 the weekly RSI registered significant bearish divergences before DJIA corrections of greater than ten percent began. As of the week of April 22nd, 2016, the weekly RSI was still at its highest point since the rally began in early 2016. This implies the DJIA could rally for several more weeks before hitting at least an intermediate peak. |
|
| Figure 1. Since 2010 the DJIA appears to be forming a five wave Elliott impulse pattern. |
| Graphic provided by: BigCharts.com. |
| |
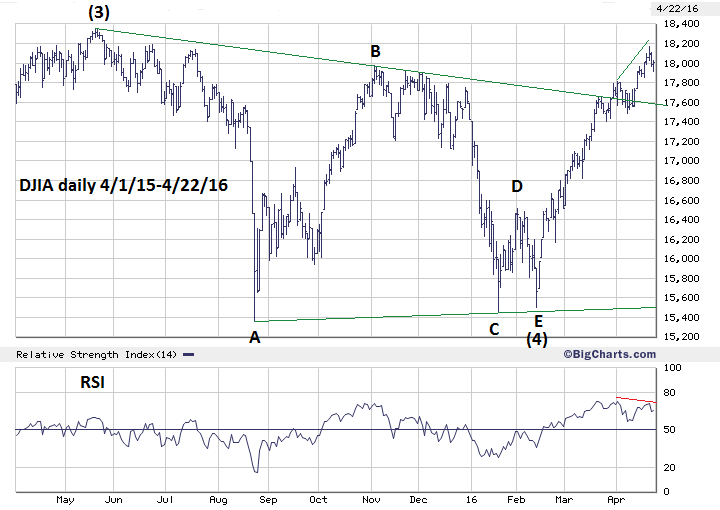
| DJIA Review — Short Term Please see the illustrated daily DJIA chart in Figure 2. The DJIA pattern from its all-time high in May 2015 to the bottom made on February 11, 2016, appears to be an Elliott wave Horizontal Triangle. The rally off this bottom has been powerful and swift which is exactly what would be expected after a Horizontal Triangle, and is referred to as a post triangle trust. Since February 11th, the DJIA has blasted through Fibonacci resistance, the 200-day Simple Moving Average, declining trendline and chart resistance. My April 13th article "Battle of Bulls vs. Bears" noted that there were four chart resistance points that the bulls could use as stepping stones to push the DJIA to new all-time highs. The DJIA has pushed above all of these points and is now poised for an assault at resistance near the all-time high, which begins at the DJIA 18,188.81 peak made on June 23rd. On April 20, 2016 the DJIA high was 18,167.63 and was accompanied by a bearish divergence on the daily RSI. Could this be the start of a correction larger than ten percent, or will it be another short shallow decline? The answer could be in the Shanghai Composite (SSEC). |
|
| Figure 2. The pattern from May 2015-February 2016 appears to be an Elliott wave Horizontal Triangle. |
| Graphic provided by: BigCharts.com. |
| |
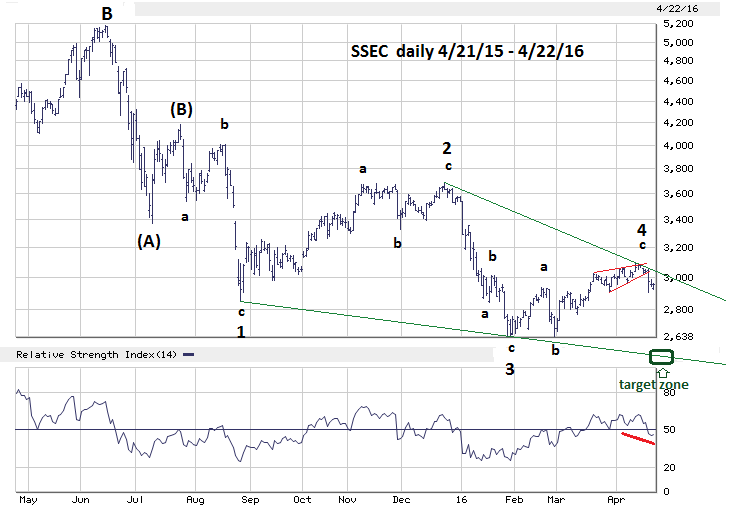
| Shanghai Composite Review Please see the illustrated daily SSEC chart in Figure 3. The last time I commented on the SSEC was in my December 16th article "The Time Factor". In early December, the SSEC looked as if it could be completing an Elliott wave Horizontal Triangle from the July 2015 bottom. That wave count was eliminated on December 23rd when the SSEC moved above the November 17th level which was wave "C" of the supposed Horizontal Triangle. The pattern since late December has been ambiguous until a few weeks ago when it appeared that the SSEC could be forming an Ending Diagonal Triangle (EDT) from the July 24th peak. Ending Diagonal Triangles are a special type of wave that can only occur in the positions of "fifth" waves and in "C" waves. They are wedge shaped and each of the sub impulse waves subdivide into three waves, not the normal five. Within an EDT, wave "Three" is always shorter than wave "One" and wave "Five" is always shorter than wave "Three" EDT's are found at termination points of a larger pattern, indicating exhaustion of the larger pattern. Upon completion of an EDT the subsequent reversal usually returns to the EDT point of origin. An example of what appears to be a small completed EDT can be seen in wave "c" of "4" on the daily SSEC chart. Because of the many variables required to form an EDT, they are excellent structures to forecast market turns. Many times "Fifth" waves are related to "First" waves by the Fibonacci ratio of .618. Wave "1" of the supposed SSEC EDT declined by 31.87% x.618 = 19.69%, subtracting this percentage from the supposed wave "4" peak of 3097.17 targets SSEC 2487.10 as the bulls-eye target for wave "5" of the EDT, which is near the declining trendline that connects the termination points of waves "1" and "3. A broader zone would be SSEC 2540-2440. Wave "1" of the EDT was 33 calendar days x .618 = 20 calendar days. The supposed wave "4" peak was April 13th adding 20 calendar days targets May 3rd as the bulls-eye day for completion of the EDT. May 2-5 would be the broader target zone. Since wave "5" of the EDT must be shorter than wave "3" we just need to know the length of wave "3" to determine the point at which the EDT pattern would be invalid. The supposed wave "3" had a decline of 28.39% subtracting this percentage from the supposed wave "4" peak at 3097.17 targets SSEC 2217.89 as the point the EDT pattern would be invalid. |
|
| Figure 3. Because of the many variables required to form an EDT, they are excellent structures to forecast market turns. |
| Graphic provided by: BigCharts.com. |
| |
| Conclusion Since June of 2015, the SSEC has been one of the weakest stock indexes in the world. If it completes the EDT pattern in early May, the subsequent rally could last two-four months. For the DJIA the current rally could last until August. Normally it's difficult to buy into a powerful rally. Traders will wait for a market to get oversold which may never happen. The DJIA rally from February 11th is a perfect example, the declines have been short and shallow. If the SSEC reaches 2440-2540 in the first week of May, it could be an opportunity to enter long positions not only on Chinese stocks, but also provide a chance to buy into continuing stock bull markets worldwide. Further Reading: Frost A.J and Robert Prechter (1985) "Elliott Wave Principle", New Classics Library. |
Independent investment advisor, trader and writer. He has written articles for Technical Analysis of Stocks & Commodities, Traders.com Advantage,Futuresmag.com and, Finance Magnates. Author of website Four Dimension Trading.
| Website: | www.fourdimensiontrading.com |
| E-mail address: | markrivest@gmail.com |
Click here for more information about our publications!
Comments

Request Information From Our Sponsors
- StockCharts.com, Inc.
- Candle Patterns
- Candlestick Charting Explained
- Intermarket Technical Analysis
- John Murphy on Chart Analysis
- John Murphy's Chart Pattern Recognition
- John Murphy's Market Message
- MurphyExplainsMarketAnalysis-Intermarket Analysis
- MurphyExplainsMarketAnalysis-Visual Analysis
- StockCharts.com
- Technical Analysis of the Financial Markets
- The Visual Investor
- VectorVest, Inc.
- Executive Premier Workshop
- One-Day Options Course
- OptionsPro
- Retirement Income Workshop
- Sure-Fire Trading Systems (VectorVest, Inc.)
- Trading as a Business Workshop
- VectorVest 7 EOD
- VectorVest 7 RealTime/IntraDay
- VectorVest AutoTester
- VectorVest Educational Services
- VectorVest OnLine
- VectorVest Options Analyzer
- VectorVest ProGraphics v6.0
- VectorVest ProTrader 7
- VectorVest RealTime Derby Tool
- VectorVest Simulator
- VectorVest Variator
- VectorVest Watchdog