HOT TOPICS LIST
- MACD
- Fibonacci
- RSI
- Gann
- ADXR
- Stochastics
- Volume
- Triangles
- Futures
- Cycles
- Volatility
- ZIGZAG
- MESA
- Retracement
- Aroon
INDICATORS LIST
LIST OF TOPICS
PRINT THIS ARTICLE
by Mark Rivest
Lessons from warfare that can improve your trading ability.
Position: N/A
Mark Rivest
Independent investment advisor, trader and writer. He has written articles for Technical Analysis of Stocks & Commodities, Traders.com Advantage,Futuresmag.com and, Finance Magnates. Author of website Four Dimension Trading.
PRINT THIS ARTICLE
MOMENTUM
Battle of Bulls vs. Bears
04/13/16 04:08:59 PMby Mark Rivest
Lessons from warfare that can improve your trading ability.
Position: N/A
| The perpetual battle of bulls vs. bears in any market has many similarities to warfare. Viewing charts as if they were battlefield maps can give you an advantage over other traders. Examination of the market dimensions of time and price from the perspective of war between two opposing forces can get you into winning trades and maximize profits. Time Dimension In war, timing is a major factor. Most wars start during a time of optimal weather. The reason is simple; the instigator of battle doesn't want to be fighting the elements and enemy soldiers at the same time. World Wars One and Two, which respectively began in early August and early September, are just two of many examples of major fighting beginning during a time of optimal weather. All markets have seasonal patterns and time cycles. Some cycles are periodic or based on the Fibonacci sequence. Then there are celestial events such as full moons and eclipses which have been known to change the mood of the mass mind. Something happened in the second half of March which requires close examination. In my March 30 article "S&P 500 Path To 2200" I noted that the S&P 500 (SPX) rally from February 11- March 18 was nearly identical in time as the September 29- November 3 rally. There were two other potential time factors I did not mention, Spring Equinox was on March 19th and a full moon on March 23rd. With time equality and two celestial events it would seem that the bears had everything going for them to halt the nearly non-stop rally from February 11th, yet the rally continued. What happened? This is where the warfare analogy comes into play. In the March 30th article I noted as of March 18th there were only nine trading days left in the first quarter and that some fund managers may have missed the rally since February, forcing them to buy declines to improve performance. After March 22nd the SPX had a very brief decline and then rallied into the end of the quarter. The overriding factor was optimal weather for the bulls, which in this case was the calendar itself. The combination of a rally and narrow time frame forced panicky bulls into more buying. What about April 1st? The beginning of the second quarter, this is another important time point in which the bears could have launched an assault. Fund managers no longer had calendar pressure and April 1st was the monthly employment report which is notorious for triggering trend changes. Stocks dropped sharply on the open and then went up the rest of the day closing at new rally highs. The peaks made on March 22nd and 30th were both powerful time resistance points and it takes a powerful move to break beyond strong resistance/support points. The move up on April 1st in particular is very impressive because the bulls no longer have optimal weather. There's something else going on and that's in the dimension of price. |
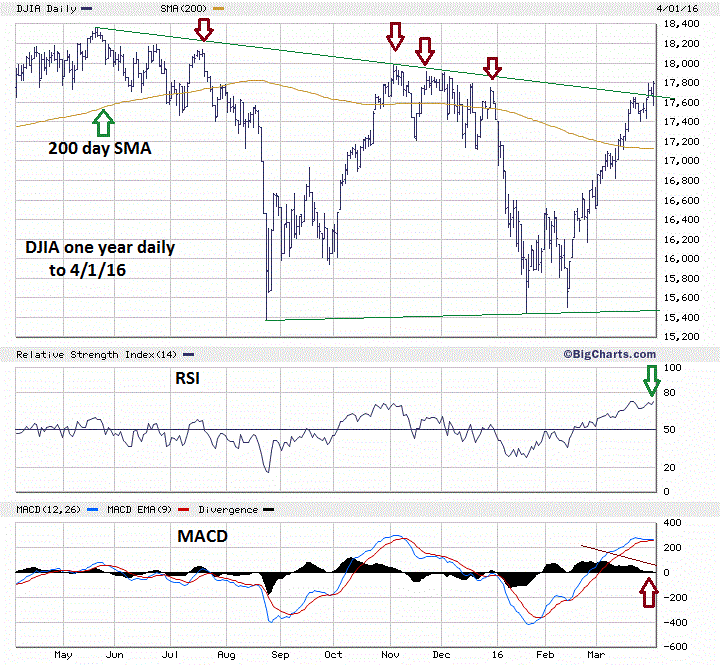
| Price Dimension In warfare, the location of battles is determined by natural and man-made features. In the American Civil War, the largest battle took place at Gettysburg, PA because there are many roads leading into the town. My March 30th article noted the SPX had a series of peaks made between November 3rd and December 29th that are in close proximity to each other that could serve as stepping stones for the bulls to push the SPX up to its all-time high and beyond to 2200. The series of peaks are the points the bears will be defending. If a peak is breached the bears will be covering their shorts which will provide additional buying power to propel the rally up to the next top, which could then trigger yet another rally to the next top. The series of peaks on both the SPX and Dow Jones Industrial Average (DJIA) are set up to fall like dominos. Please see the illustrated daily DJIA chart in Figure 1. In terms of taking out price obstacles the DJIA is in the lead. So far, it's exceeded the 200-day Simple Moving Average (SMA), the .618 retrace of the May-August decline, the May-November trend-line and the December 29th price peak implying the SPX will soon be following. The ammunition that's keeping the rally going is momentum. Note that the daily RSI still does not have a bearish divergence. The vast majority of the time this indicator needs at least one bearish divergence before a stock market correction can occur. The daily MACD histogram is showing a bearish divergence, but if there is a decline it will likely be brief because of the signal coming from the weekly MACD. |

|
| Figure 1. DJIA Daily. |
| Graphic provided by: BigCharts.com. |
| |
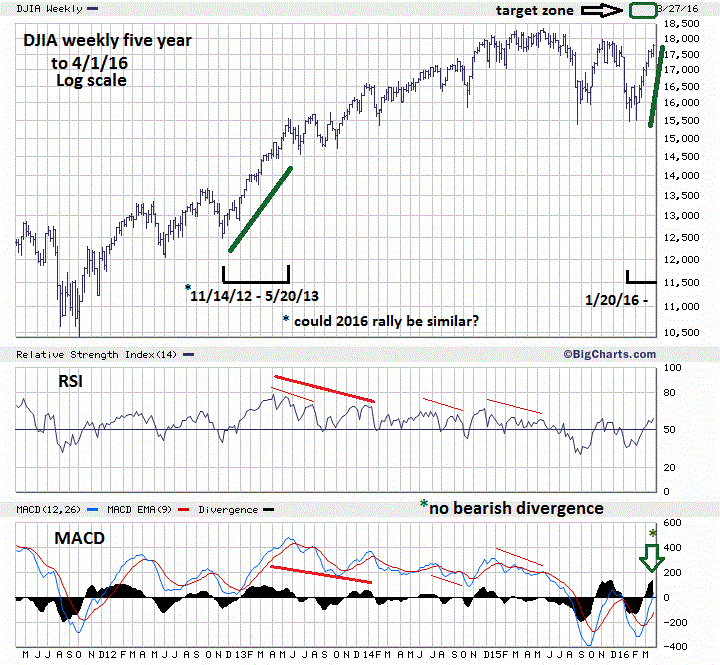
| Price Dimension-Long Term Please see the illustrated weekly DJIA chart in Figure 2. Note that the weekly MACD histogram has no bearish divergence implying the current rally could last for several more weeks. The current rally off of the January/February lows has been relentless. To get a perspective of what may happen next it's important to see what happened the last time the DJIA had a relentless rally. Note on the weekly chart the 24.6% rally between November 2012 abd May 2013. In terms of price, if the rally from January 2016 can repeat that performance it targets DJIA 19250, the broader price zone is 19000-19300. Note, however, that the rate of ascent for the current rally is steeper than the 2012-2013 rally. This is evidence that a post triangle thrust up from the February 11th bottom is probably under construction. My February 25th article "Bullish Divergence Abound" noted the DJIA on February 11th had probably completed an Elliott wave Horizontal Triangle. The moves subsequent to this pattern are usually sharp and move beyond the triangles point of origin. The 2012-2013 rally lasted six months, the more rapid ascent of the current rally implies it may last three-four months targeting late April-late May for a possible peak. |

|
| Figure 2. DJIA Weekly. |
| Graphic provided by: BigCharts.com. |
| |
| Strategy Continue holding long stock positions. It's possible even now to add on new long positions. Declines will probably be small. If the SPX declines longer than five trading days or declines more than 55.70 SPX points it would be a clue that something more bearish is developing. If either of these events happen take defensive action with partial liquidations of some positions. The battle that took place on SPX and DJIA in the second half of March 2016 needs to be remembered. At any point the markets will have a multitude of signals, some bullish, some bearish. View each market as a battlefield, learn where and when each side will either attack or defend. It is through this perspective that you will be able discover the true path of the markets and the path to victory! |
Independent investment advisor, trader and writer. He has written articles for Technical Analysis of Stocks & Commodities, Traders.com Advantage,Futuresmag.com and, Finance Magnates. Author of website Four Dimension Trading.
| Website: | www.fourdimensiontrading.com |
| E-mail address: | markrivest@gmail.com |
Click here for more information about our publications!
PRINT THIS ARTICLE

Request Information From Our Sponsors
- VectorVest, Inc.
- Executive Premier Workshop
- One-Day Options Course
- OptionsPro
- Retirement Income Workshop
- Sure-Fire Trading Systems (VectorVest, Inc.)
- Trading as a Business Workshop
- VectorVest 7 EOD
- VectorVest 7 RealTime/IntraDay
- VectorVest AutoTester
- VectorVest Educational Services
- VectorVest OnLine
- VectorVest Options Analyzer
- VectorVest ProGraphics v6.0
- VectorVest ProTrader 7
- VectorVest RealTime Derby Tool
- VectorVest Simulator
- VectorVest Variator
- VectorVest Watchdog
- StockCharts.com, Inc.
- Candle Patterns
- Candlestick Charting Explained
- Intermarket Technical Analysis
- John Murphy on Chart Analysis
- John Murphy's Chart Pattern Recognition
- John Murphy's Market Message
- MurphyExplainsMarketAnalysis-Intermarket Analysis
- MurphyExplainsMarketAnalysis-Visual Analysis
- StockCharts.com
- Technical Analysis of the Financial Markets
- The Visual Investor
