HOT TOPICS LIST
- MACD
- Fibonacci
- RSI
- Gann
- ADXR
- Stochastics
- Volume
- Triangles
- Futures
- Cycles
- Volatility
- ZIGZAG
- MESA
- Retracement
- Aroon
INDICATORS LIST
LIST OF TOPICS
PRINT THIS ARTICLE
by Mark Rivest
Powerful evidence suggests during 2016 the S&P 500 could reach 2200. However, a correction could be imminent. Let's see what's developing.
Position: N/A
Mark Rivest
Independent investment advisor, trader and writer. He has written articles for Technical Analysis of Stocks & Commodities, Traders.com Advantage,Futuresmag.com and, Finance Magnates. Author of website Four Dimension Trading.
PRINT THIS ARTICLE
MOMENTUM
S&P 500 Path To 2200
03/30/16 11:54:04 AMby Mark Rivest
Powerful evidence suggests during 2016 the S&P 500 could reach 2200. However, a correction could be imminent. Let's see what's developing.
Position: N/A
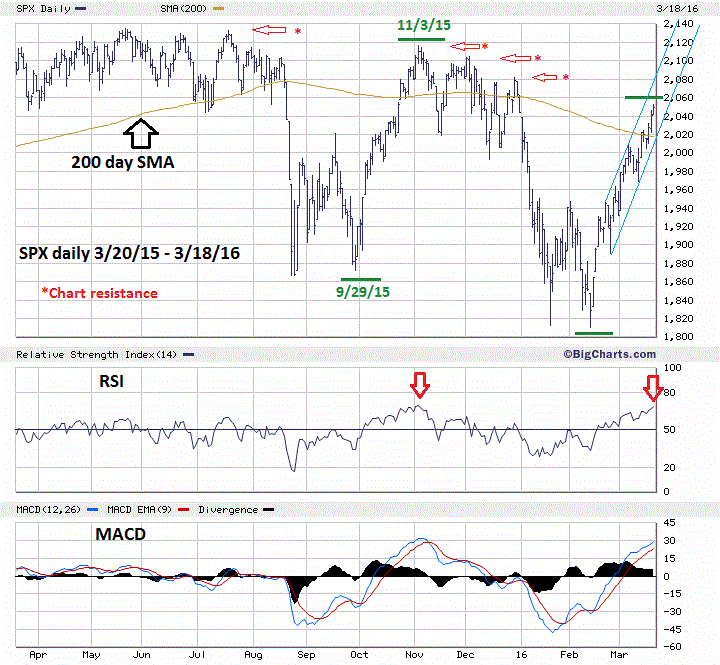
| In my February 25th article "Bullish Divergences Abound" a case was made that that February 11th was probably an important bottom for both US stocks and crude oil. The primary evidence at the time were many bullish momentum divergences that occurred in early February. Now in mid- March, with the S&P 500 (SPX) 240 points higher we are bearing the fruit of the bullish seeds planted on February 11th. As of the close on March 18th US stocks, and in particular the SPX, look poised for a decline, a detailed examination of both bullish and bearish evidence is needed. SPX Bullish and Bearish Evidence Please see the illustrated daily SPX chart illustrated in Figure 1. Recently the SPX has taken out three nearby resistance levels. The first was at 2010 which is the .618 retrace of the May-February decline. The second was at 2020 at the 200-day Simple Moving Average (SMA). The third was at the early January price gap of 2038-2041. When a resistance level is breached usually two things happen; the bulls add on new long positions, and the bears cover their short positions pushing prices even higher until the next resistance level is reached. With the close proximity of the three recent SPX resistance levels, the bulls have been able to knock them all down like dominos. Note what is above where the SPX closed on March 18th, four additional resistances levels that bulls could topple in quick succession. It's possible the SPX could reach round number resistance at 2200 by the first half of April. There is however one factor in both the dimensions of price and time that could herald a significant correction — that factor is equality. The September 29th-November 3rd rally was 35 calendar days and 244.57 SPX points. The February 11th-March 18th rally is 36 calendar days and 242.26 points, nearly identical. This fits in perfectly with the Elliott wave guide line for wave equality. It implies a significant decline may have already begun and if not, could start very soon. On the other side of the coin are factors within the dimensions of momentum and sentiment that indicate the rally will continue. The first is the RSI momentum indicator. At the November 3rd SPX peak the RSI also hit its peak. The vast majority of the time, RSI needs to have at least one bearish divergence before the SPX can go into a significant retracement. As of the March 18th close RSI is again at its peak along with the SPX. The SPX decline after the November 3rd top was very rare; it could happen again but the probabilities are very low. In the dimension of sentiment, the Market Vane bullish consensus reading in early November was 65%, the reading in mid-March after a rapid 240 SPX point rally was only 54%. This indicates continued skepticism of the rally and from a contrary opinion point of view argues for higher prices. There could also be a bullish factor from the time dimension. The November 3rd peak was early in the fourth quarter of the year, the March 18th high is late in the first quarter. It's possible there are some fund managers that missed some of the rally from the February 11th bottom and maybe have funds still to allocate. If so, as of March 18th, they have only nine trading days left in the quarter to allocate their cash. Chances are that a fund manager under pressure to improve their performance would be buying rather than selling into market declines. |

|
| Figure 1. S&P500 Daily. Recently the SPX has taken out three nearby resistance levels. |
| Graphic provided by: BigCharts.com. |
| |
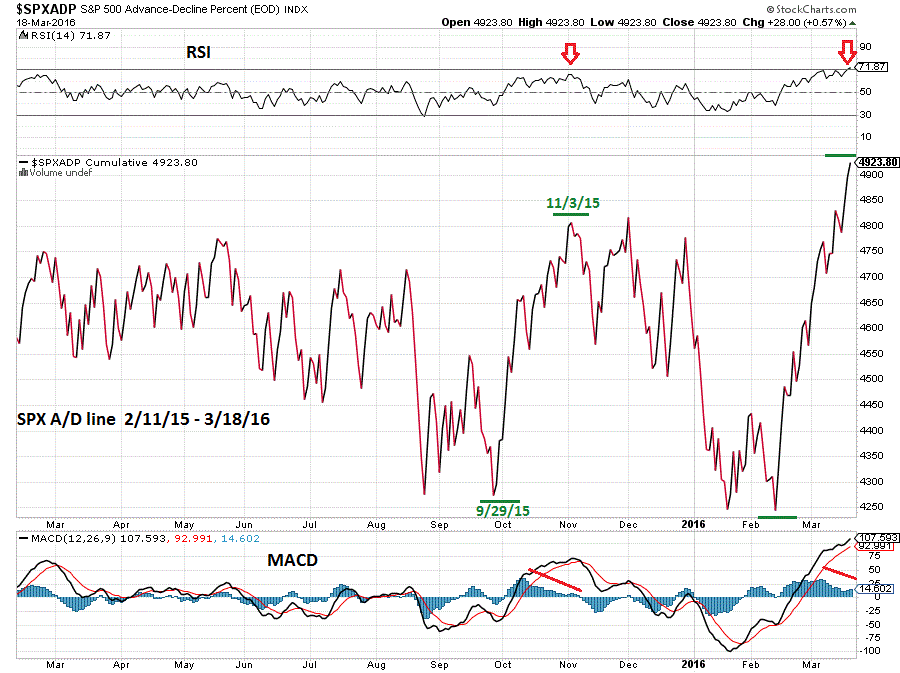
| SPX Advance/Decline Line Please see the illustrated daily cumulative SPX Advance/Decline line in figure 2. Underneath the surface an examination of the SPX A/D line reveals additional bullish evidence. First the February-March rally is 27% larger than the September-November rally. This indicates greater strength and increases the chances the rally will continue. The MACD indicator has a bearish divergence that is much less severe than the divergence registered in November. The RSI is currently higher than the November reading and still has no bearish divergences. The combined evidence from the SPX A/D line indicates that the line and prices will continue higher. |

|
| Figure 2. SPX Daily With A/D Line. Underneath the surface, an examination of the SPX A/D line reveals additional bullish evidence. |
| Graphic provided by: StockCharts.com. |
| |
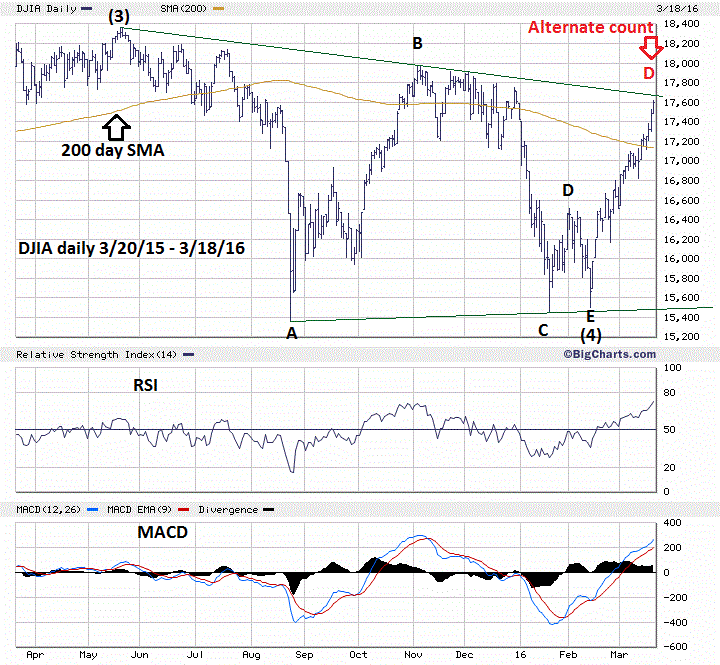
| Dow Jones Industrial Average (DJIA) Please see the illustrated daily DJIA chart in Figure 3. The primary Elliott wave count illustrates that wave "E" of a Horizontal Triangle is probably in place at the February 11th low. The powerful rally subsequent to that low looks like a typical post triangle thrust up. If so, the rally could continue to at least a marginal new all-time high for the DJIA. However, as of March 18th, the DJIA is very close to the Horizontal Triangle upper trendline. This opens up the possibility that wave "D" of the triangle is still under construction. If so, the subsequent wave "E" decline could go down the lower trendline near DJIA 15,600. A move above the upper trendline would be additional evidence that the rally will continue. |

|
| Figure 3. The primary Elliott wave count illustrates that wave "E" of a Horizontal Triangle is probably in place at the February 11th low. |
| Graphic provided by: BigCharts.com. |
| |
| Strategy Continue to hold stocks as the majority of the evidence suggests the rally will continue and declines should be brief and shallow. If any of the following happen it is a cautionary signal. 1) The biggest decline since the February 11th rally began was 55.70 SPX points made February 22-24. Any decline larger than 55.70 points would be a clue that something more bearish could be developing. 2) The longest decline since February 11th was four trading days (March 4-10). Any decline longer than four trading days would be a clue that something more bearish could be developing. 3) Please see the daily SPX chart in Figure 1. A break below the lower trendline that connects the bottoms of February 23rd and March 10th would also be a clue of something more bearish developing. If any of these signals occur, partial liquidations of some long positions would be warranted. Big up moves in the stock market don't happen very often and are difficult to recognize as you're in the movement. You need to ride these rallies as long as possible to produce maximum profits. Momentum and sentiment indicators suggest the next few weeks could be heaven for the bulls and hell for the bears. Further reading: Frost A.J and Robert Prechter (1985) "Elliott Wave Principle", New Classics Library. Rivest, Mark Wall Street-ese", Technical Analysis of Stocks & Commodities. April 2016 issue. |
Independent investment advisor, trader and writer. He has written articles for Technical Analysis of Stocks & Commodities, Traders.com Advantage,Futuresmag.com and, Finance Magnates. Author of website Four Dimension Trading.
| Website: | www.fourdimensiontrading.com |
| E-mail address: | markrivest@gmail.com |
Click here for more information about our publications!
Comments
Date: 04/30/16Rank: 4Comment:

|

Request Information From Our Sponsors
- VectorVest, Inc.
- Executive Premier Workshop
- One-Day Options Course
- OptionsPro
- Retirement Income Workshop
- Sure-Fire Trading Systems (VectorVest, Inc.)
- Trading as a Business Workshop
- VectorVest 7 EOD
- VectorVest 7 RealTime/IntraDay
- VectorVest AutoTester
- VectorVest Educational Services
- VectorVest OnLine
- VectorVest Options Analyzer
- VectorVest ProGraphics v6.0
- VectorVest ProTrader 7
- VectorVest RealTime Derby Tool
- VectorVest Simulator
- VectorVest Variator
- VectorVest Watchdog
- StockCharts.com, Inc.
- Candle Patterns
- Candlestick Charting Explained
- Intermarket Technical Analysis
- John Murphy on Chart Analysis
- John Murphy's Chart Pattern Recognition
- John Murphy's Market Message
- MurphyExplainsMarketAnalysis-Intermarket Analysis
- MurphyExplainsMarketAnalysis-Visual Analysis
- StockCharts.com
- Technical Analysis of the Financial Markets
- The Visual Investor
