HOT TOPICS LIST
- MACD
- Fibonacci
- RSI
- Gann
- ADXR
- Stochastics
- Volume
- Triangles
- Futures
- Cycles
- Volatility
- ZIGZAG
- MESA
- Retracement
- Aroon
INDICATORS LIST
LIST OF TOPICS
PRINT THIS ARTICLE
by Mark Rivest
Multiple bullish divergence in oil and stocks point to higher prices for both.
Position: N/A
Mark Rivest
Independent investment advisor, trader and writer. He has written articles for Technical Analysis of Stocks & Commodities, Traders.com Advantage,Futuresmag.com and, Finance Magnates. Author of website Four Dimension Trading.
PRINT THIS ARTICLE
MOMENTUM
Bullish Divergences Abound
02/25/16 11:19:08 AMby Mark Rivest
Multiple bullish divergence in oil and stocks point to higher prices for both.
Position: N/A
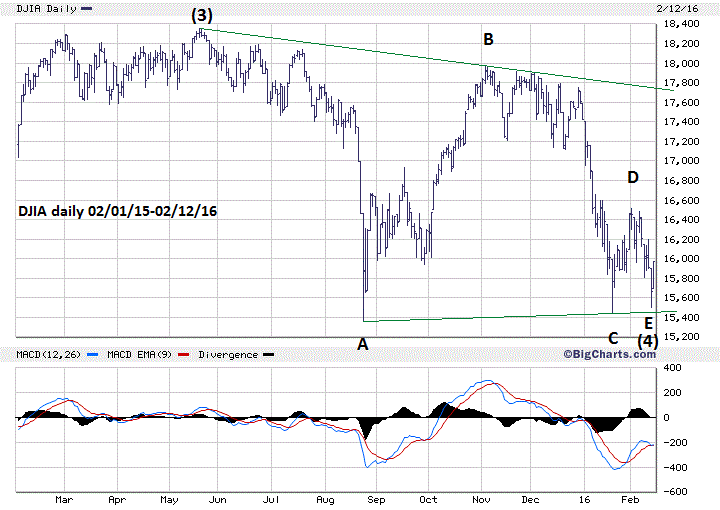
| Since the middle of January US stock indices and oil have been flashing signals of a potential bottom, yet both have continued lower. On February 11, 2016 many bullish divergences were recorded for both stocks and oil that strongly indicate an important bottom has been reached. The signals recorded on February 11th are very powerful and bullish. Dow Jones Industrial Average (DJIA) For months I've speculated that one of the three main US stock indices could be forming an Elliott Wave "Horizontal Triangle". As of February 11th the DJIA has completed a Horizontal Triangle pattern that began on May 19th. Please see the daily DJIA chart illustrated in Figure 1. If this wave count is correct the DJIA will probably rally in the next few months to a new all-time high. If the wave count is incorrect a break below the DJIA January 20th bottom would be a caution sign and a break below the August 24th bottom would invalidate the count, implying something more bearish is developing. |

|
| Figure 1. DJIA Daily. Horizontal Triangle from May 19th counts as complete. |
| Graphic provided by: BigCharts.com. |
| |
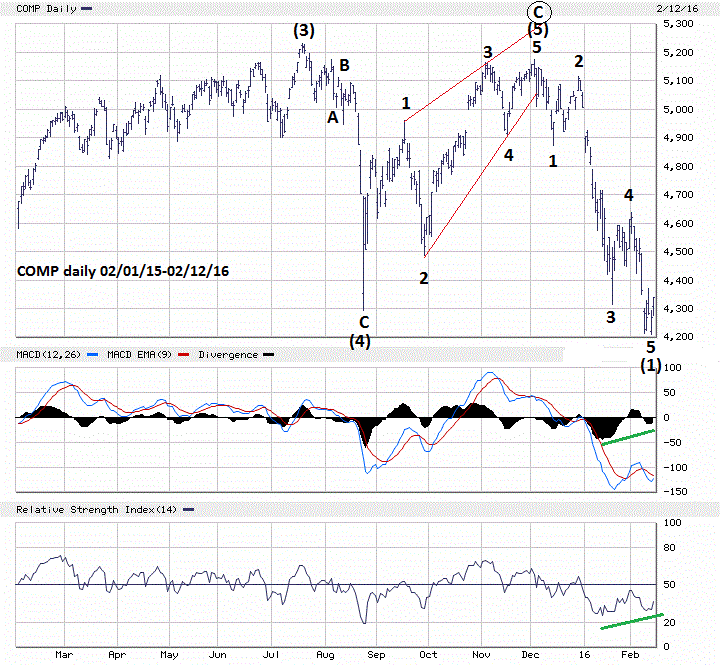
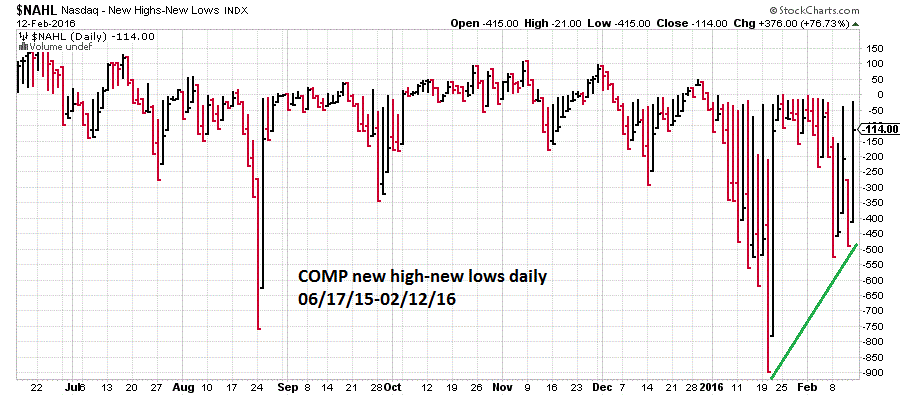
| Nasdaq Composite (COMP) The COMP has been the weakest of the three main US stock indices declining over 19% from its all-time high in July. My December 8th article "Three Paths To Profits" noted that the one possible Elliott wave count was that the rally from the August 24th bottom could an "Ending Diagonal Triangle" (EDT). Please see the daily COMP chart illustrated in Figure 2. The COMP from August 24th can be counted as an EDT and the subsequent decline counts as a standard five wave pattern. The overall pattern from July implies that the COMP November-February decline is just the first wave down of a larger decline that could develop in the coming months. Even if this bearish count is correct, COMP is ready for a significant move up. Note that both the daily RSI and MACD are showing bullish divergences, and that's not all. Please see the daily COMP new highs- new lows chart illustrated in Figure 3. This indicator is showing a double bullish divergence vs. the January 20th bottom. Also on February 11th the Nasdaq 100 (NDX) held above its February 8th bottom. If a rally does develop for COMP a typical wave "Two" rally usually retraces 61% of the prior wave "One" decline. This targets COMP 4800. If the rally can exceed 4900 it implies something more bullish is developing. |

|
| Figure 2. NASDAQ Daily. The November-February decline may be the first wave down of a larger developing decline. |
| Graphic provided by: BigCharts.com. |
| |
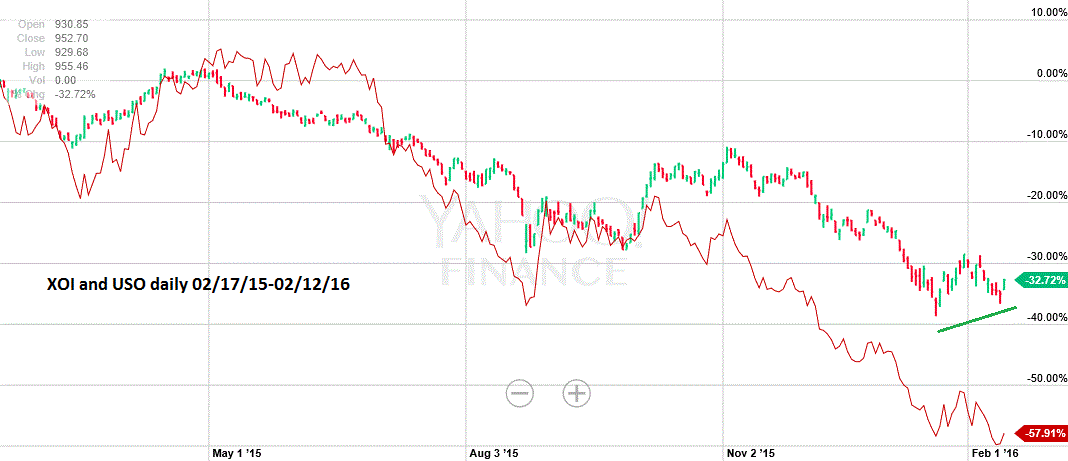
| Crude Oil On January 20th, Crude Oil represented by the United States Oil ETF (USO) made a new low accompanied by the Energy sector ETF (XLE) and the Oil & Gas index (XOI). On February 11th, the USO made a marginal new low unconfirmed by both the XLE AND XOI. Please see the daily XOI and USO chart illustrated in Figure 4. And there's more, on January 20th April Crude Oil futures made a new low accompanied by the April Heating Oil futures. On February 11th April Crude Oil made a new low while April Heating Oil held well above its January 20th bottom. For several months oil has been moving in the same direction as stocks. Ff this trend continues we may see a rally in both soon. |

|
| Figure 3. NASDAQ New Highs-New Lows Daily. A double bullish divergence vs. the January 20th bottom. |
| Graphic provided by: StockCharts.com. |
| |
| Summary and Strategy The price dimension: On February 11th, DJIA and COMP completed Elliott wave patterns from their respective 2015 peaks. The S&P 500 (SPX) has bottomed at 1810 which is very close to chart support at the February 2014 low and a .236 retracement of the bull market from 2009 at 1789. The momentum dimension: On February 11th, the daily SPX and COMP recorded daily RSI and MACD bullish divergences. COMP new highs - new lows show a double bullish divergence. NDX has a bullish divergence vs. COMP. Mid Cap S&P 400 (MDY) has a bullish divergence vs. SPX. The Oil complex is showing multiple bullish divergence. The sentiment dimension: During the week of February 8-12 the Market Vane bullish consensus reading was 47%. This is the lowest reading since at least 2012 and implies an intermediate bottom. The time dimension: January and February are seasonally bullish for stocks. That the main US indices declined in this time zone implies something more bearish could be developing. |

|
| Figure 4. XOI and USO Daily. XOI holds above January 20th bottom. |
| Graphic provided by: Yahoo! Finance. |
| |
| The bulk of evidence from the four market dimensions strongly suggest that both stocks and oil have made bottoms that could hold for several months. My February 12th article "US Stock Indices Continue To Build A Base" noted that as of February 5th there were reasons to be cautious and to use SPX 1812 as a level to start partial liquidations of long positions. The SPX did subsequently breech this level by two points and then rallied. Because of the powerful evidence that an important bottom could be in place continue to accumulate long positions in large cap stocks that are outperforming the broader stock market. Yes, it's frustrating to take defensive action and then go back on the offense. If you're new to trading get used to this, markets are notorious for faking us out. The markets can fool us some of the time but they can't fool us all of the time. The key to being a successful trader is to stay calm and trust the indicators. In mid-February 2016 the indicators for stocks and oil are table pounding bullish. Further reading: Frost A.J. and Robert Prechter (1985) "Elliott Wave Principle", New Classics Library. |
Independent investment advisor, trader and writer. He has written articles for Technical Analysis of Stocks & Commodities, Traders.com Advantage,Futuresmag.com and, Finance Magnates. Author of website Four Dimension Trading.
| Website: | www.fourdimensiontrading.com |
| E-mail address: | markrivest@gmail.com |
Click here for more information about our publications!
PRINT THIS ARTICLE

Request Information From Our Sponsors
- StockCharts.com, Inc.
- Candle Patterns
- Candlestick Charting Explained
- Intermarket Technical Analysis
- John Murphy on Chart Analysis
- John Murphy's Chart Pattern Recognition
- John Murphy's Market Message
- MurphyExplainsMarketAnalysis-Intermarket Analysis
- MurphyExplainsMarketAnalysis-Visual Analysis
- StockCharts.com
- Technical Analysis of the Financial Markets
- The Visual Investor
- VectorVest, Inc.
- Executive Premier Workshop
- One-Day Options Course
- OptionsPro
- Retirement Income Workshop
- Sure-Fire Trading Systems (VectorVest, Inc.)
- Trading as a Business Workshop
- VectorVest 7 EOD
- VectorVest 7 RealTime/IntraDay
- VectorVest AutoTester
- VectorVest Educational Services
- VectorVest OnLine
- VectorVest Options Analyzer
- VectorVest ProGraphics v6.0
- VectorVest ProTrader 7
- VectorVest RealTime Derby Tool
- VectorVest Simulator
- VectorVest Variator
- VectorVest Watchdog
