HOT TOPICS LIST
- MACD
- Fibonacci
- RSI
- Gann
- ADXR
- Stochastics
- Volume
- Triangles
- Futures
- Cycles
- Volatility
- ZIGZAG
- MESA
- Retracement
- Aroon
INDICATORS LIST
LIST OF TOPICS
PRINT THIS ARTICLE
by Mark Rivest
The balance of evidence suggest US stock indices are in bull mode, however there are cautionary signals. Learn how to navigate the upcoming turns.
Position: N/A
Mark Rivest
Independent investment advisor, trader and writer. He has written articles for Technical Analysis of Stocks & Commodities, Traders.com Advantage,Futuresmag.com and, Finance Magnates. Author of website Four Dimension Trading.
PRINT THIS ARTICLE
ELLIOTT WAVE
US Stock Indices Continue To Build A Base
02/12/16 04:12:00 PMby Mark Rivest
The balance of evidence suggest US stock indices are in bull mode, however there are cautionary signals. Learn how to navigate the upcoming turns.
Position: N/A
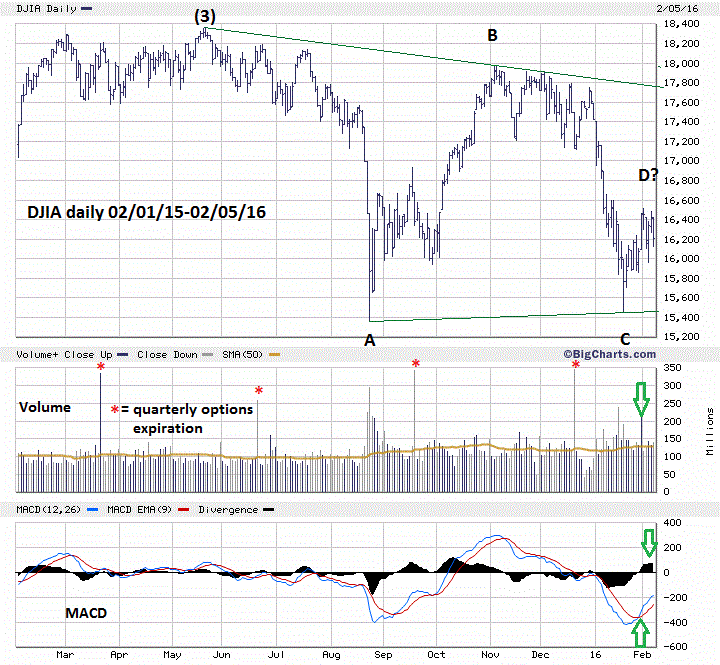
| Dow Jones Industrial Average (DJIA) My December 8th article "Three Paths To Profits" illustrated two Elliott wave corrective patterns that could materialize, a Horizontal Triangle and a Double Zigzag. As of the January 20th bottom it appears the DJIA and Nasdaq Composite (COMP) are still forming Horizontal Triangles while the S&P 500 (SPX) has completed a Double Zigzag pattern from its May 20th peak. Please see the illustrated daily DJIA chart in Figure 1. This wave count illustrates a possible Horizontal Triangle forming from the DJIA peak on May 19th. The supposed wave "D" from the January 20th bottom sub divides into three waves as expected for each component wave of a Horizontal Triangle. There is also a Fibonacci relationship with wave "B" of the Horizontal Triangle. The August-November rally was 2607.52 DJIA points x .382 = 996.07 + 15450.56 the January 20th bottom = 16446.63. The peak on February 1st was 16510.98, a difference of only 64.66 points, or .0039, which is within the leeway for a Fibonacci coordinate. Excluding quarterly options expirations, which always have very high volume due to arbitrage, the DJIA volume on January 29th was the highest volume on an up day since February 24, 2014. This former signal was close to a bottom made on February 5, 2014. The subsequent rally lasted until July 17, 2014. The SPX on January 29th had its highest up day volume since November 30th 2011. High volume up days are a clue of institutional buying and implies the rally could last several months. The MACD has recorded two bullish signals. The first is a bullish crossover on February 1st and the second on February 4th when the Histogram hit a high of 83%. In stock bull moves this indicator almost always has to show a bearish divergence before a significant downturn can occur. |

|
| Figure 1. DJIA Daily. Volume and MACD have bullish signals. |
| Graphic provided by: BigCharts.com. |
| |
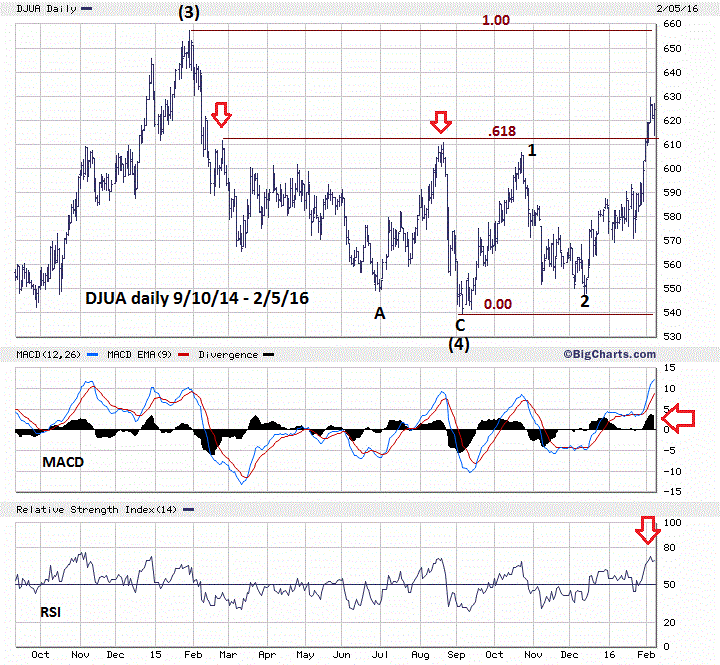
| Dow Jones Utility Average (DJUA) On August 20th the DJUA was out performing the main US stock indices, then dramatically in just two weeks the DJUA had a powerful decline and was underperforming the main indices. My September 15th article, "Adding Fuel To The Fire", noted that the September 4th low of 539 was a significant support zone. The support held and recently the DJUA has broken above significant resistance. Please see the illustrated daily DJUA chart in Figure 2. The DJUA has broken above chart resistance, the minor top made on February 24th at 611.45, the intermediate peak on August 20th at 610.92. Additionally, a move above .618 retracement of the bear move from January-September at 612.39. This breakthrough strongly implies a move up to the area of the all-time high near 657. Momentum indicators support this theory because both the daily RSI and MACD Histogram have confirmed the recent price high at 629. The big question — Is the DJUA a leader or laggard? In 2000 the DJUA hit its peak months after the three main US stock indices. The same thing happened 2007-2008. If the DJUA can make a new all-time high in 2016, perhaps it again will be making this high all by itself, if so this could be a major sell signal for all stock indices. In the near term if the DJUA can get near the old high at 657 most other stock indices will probably rally in its wake. |

|
| Figure 2. DJUA Daily. DJUA has recently broken through significant resistance. |
| Graphic provided by: BigCharts.com. |
| |
| FANG Stocks and Strategy The FANG stocks; Facebook (FB), Amazon.com (AMZN), Netflix (NFLX) and Alphabet (GOOGL) are losing momentum. Please see Matt Blackman's terrific January 29th article in Traders.com Advantage, "FANG Stocks Are Faltering - Should We Be Worried?" After the January 20th bottom FB and GOOGL made new highs confirming they are still in bull mode. However, both AMZN and NFLX are trading below the bottoms they made on January 20th. These former market leaders are now laggards-a definite sign of caution for the main US stock indices, especially COMP. The balance of evidence is bullish for US stock indices yet at the same time we need to be prepared if the situation turns bearish. My February 2nd article, "The Big Picture For US Stocks", recommended using SPX 1760 as a guideline for stop losses. Continue using this level and also the recent bottom at 1812. If the SPX were to break below 1812, start partial liquidations of long positions. If there's a break below 1760 exit all long positions. As long as the SPX is trading above 1812 there are still opportunities to buy large cap stocks that are outperforming the broader market averages. The question of bull or bear market for stocks could be cleared up soon, perhaps as early as February 12th. Regardless of direction, the key to trading success is mental flexibility. Being able to quickly change your opinion when the evidence dictates a change is what separates winning traders from losing traders. |
| Further reading: Frost A.J and Robert Prechter (1985) "Elliott Wave Principle", New Classics Library. Matt Blackman: Traders.com Advantage January 29, 2016 "FANG Stocks Are Faltering - Should We Be Worried?" |
Independent investment advisor, trader and writer. He has written articles for Technical Analysis of Stocks & Commodities, Traders.com Advantage,Futuresmag.com and, Finance Magnates. Author of website Four Dimension Trading.
| Website: | www.fourdimensiontrading.com |
| E-mail address: | markrivest@gmail.com |
Click here for more information about our publications!
PRINT THIS ARTICLE

|

Request Information From Our Sponsors
- StockCharts.com, Inc.
- Candle Patterns
- Candlestick Charting Explained
- Intermarket Technical Analysis
- John Murphy on Chart Analysis
- John Murphy's Chart Pattern Recognition
- John Murphy's Market Message
- MurphyExplainsMarketAnalysis-Intermarket Analysis
- MurphyExplainsMarketAnalysis-Visual Analysis
- StockCharts.com
- Technical Analysis of the Financial Markets
- The Visual Investor
- VectorVest, Inc.
- Executive Premier Workshop
- One-Day Options Course
- OptionsPro
- Retirement Income Workshop
- Sure-Fire Trading Systems (VectorVest, Inc.)
- Trading as a Business Workshop
- VectorVest 7 EOD
- VectorVest 7 RealTime/IntraDay
- VectorVest AutoTester
- VectorVest Educational Services
- VectorVest OnLine
- VectorVest Options Analyzer
- VectorVest ProGraphics v6.0
- VectorVest ProTrader 7
- VectorVest RealTime Derby Tool
- VectorVest Simulator
- VectorVest Variator
- VectorVest Watchdog
