HOT TOPICS LIST
- MACD
- Fibonacci
- RSI
- Gann
- ADXR
- Stochastics
- Volume
- Triangles
- Futures
- Cycles
- Volatility
- ZIGZAG
- MESA
- Retracement
- Aroon
INDICATORS LIST
LIST OF TOPICS
PRINT THIS ARTICLE
by Mark Rivest
The S&P 500 now has potential to reach 1600 by the end of October. Here's why.
Position: N/A
Mark Rivest
Independent investment advisor, trader and writer. He has written articles for Technical Analysis of Stocks & Commodities, Traders.com Advantage,Futuresmag.com and, Finance Magnates. Author of website Four Dimension Trading.
PRINT THIS ARTICLE
SUPPORT & RESISTANCE
Adding Fuel To The Fire
09/15/15 05:16:07 PMby Mark Rivest
The S&P 500 now has potential to reach 1600 by the end of October. Here's why.
Position: N/A
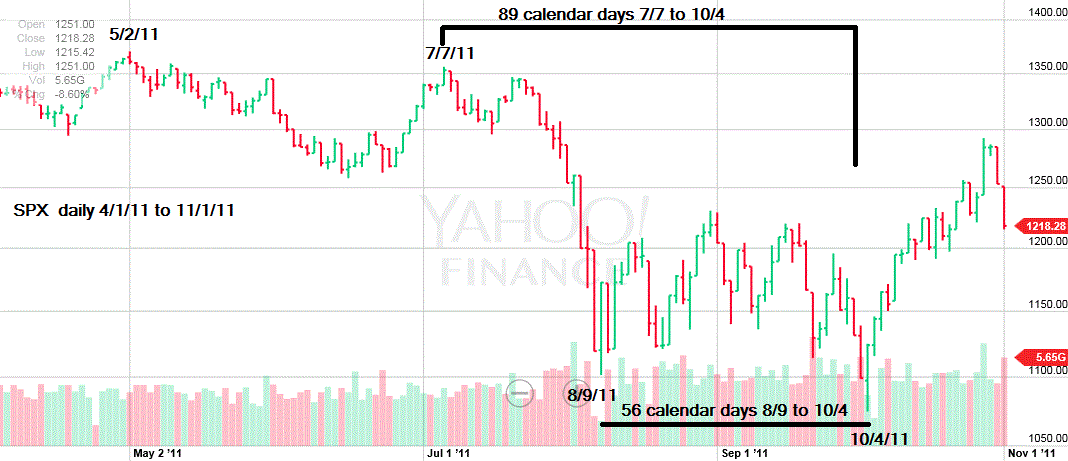
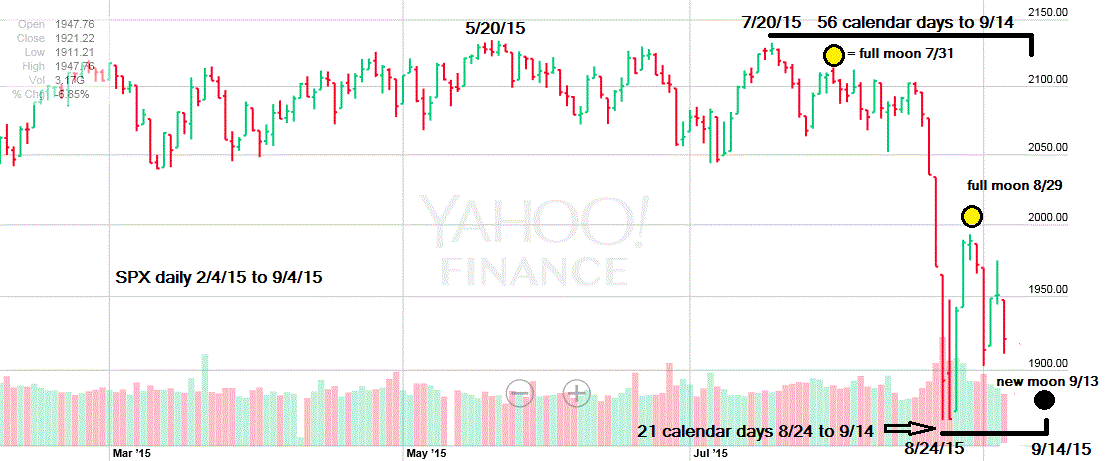
| For several months the S&P 500 (SPX) level of 1830-1780 has been a potential area of important support. Something started on August 20th that could cause the SPX to fall all the way down to the 1610-1560 zone by at the latest the end of October 2015. First let's examine what could be important turn dates coming up very soon. Time dimension-SPX in 2011 vs. 2015 Its been fascinating to follow the similarities of the SPX in 2015 with what happened in 2011. Please see my September 3rd article "The S&P 500 In 2015 Tracks 2011" In addition to pattern there is also a Fibonacci time cycle in 2011 that may provide clues to a potential market turn in 2015. Please see the illustrated SPX 2011 daily chart in Figure 1 and the illustrated SPX 2015 daily chart in Figure 2. Sometimes markets move in increments of Fibonacci numbers, the Fibonacci sequence is 1 ,1, 2 ,3 ,5, 8, 13, 21, 34, 55, 89, 144, and so on. Adding 89 days after the secondary peak of July 7, 2011 targeted the bottom made October 4, 2011. A confirming calculation using the August 9th 2011 bottom adding 55 +1 also targets October 4, 2011. The same phenomenon could happen in 2015. 56 days after the secondary peak of July 20th targets September 14th as a possible turn date. Adding 21 days to the August 24th bottom also targets September 14th. The last two full moons occurred near stock market turning points. Perhaps the latest new moon which is also a partial solar eclipse on Sunday September 13th could signal a market turn? Fibonacci time analysis can only tell us when a turn may come, not whether it is a peak or a bottom, the action taken by a market as it enters a time zone will indicate potential highs and lows. If the SPX is declining on September 14th and within the price zone of 1830-1780 this would be the time and place to enter long stock positions. There very important Fibonacci support at SPX 1789.49, please see my June 8th article "The Golden Section". Whenever a market enters a Fibonacci time zone near Fibonacci support/resistance there is a high probability a turn could be at hand. Use SPX 1765 level as a stop loss guide point for any SPX related trading instruments. If not stopped out exit all long positions by the close on September 16th which is the day before the FOMC announcement. More about this at the end of the article. One final note about the Fibonacci time cycle, there is another potential time zone October 17-18... more about this in a future article if necessary. |

|
| Figure 1. SPX 2011 Daily Chart. |
| Graphic provided by: Yahoo! Finance. |
| |
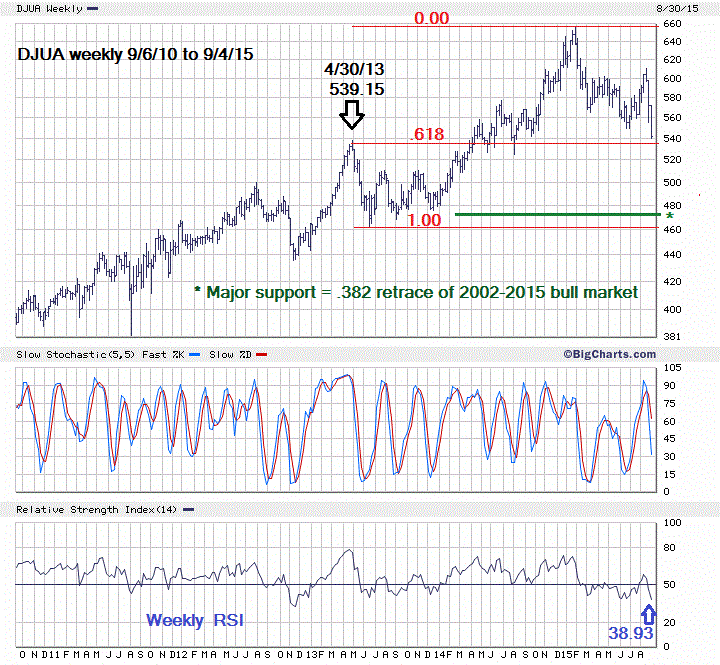
| Dow Jones Utility Average The decline of the Dow Jones Utility Average (DJUA) from its August 20th peak has been vicious, within a few days this index had a very sharp decline. The drop into September 4th has been a Elliott five wave impulse and is sitting on a significant area of support. The low so far is at 539.30 close to a .618 retrace of the bull move from 462.48. There is also support from the April 30, 2013 peak at 539.15. A rally off of this support is a high probability, however this rally could be short lived because of bearish momentum. Please see the illustrated chart of the weekly DJUA in figure 3. On September 4th the weekly RSI broke a possible bullish divergence with the June 30th bottom and made a new low at 38.93. This reading is well above the start of the oversold zone at 30. Additionally the weekly Stochastic recently recorded a bearish crossover, the signals from these indicators strongly implies that lower prices could be coming in just a few weeks. If the current support zone is broken the next significant support is at DJUA 460 to 480. The DJUA is the additional fuel to the bearish fire, if the DJUA can break below significant support at the 539 area there's a good chance this could trigger more selling in the broader stock market. In terms of the SPX this could mean breaking below the support level at 1789 and could go down to the next support level near 1576. Again, please see my June 8th article. One reason a sharp decline of the DJUA can be a bearish signal for the broader stock market is because it's very sensitive to interest rate changes. The DJUA all time high came on January 28, 2015 just two days before a 34 year low in the 30 Year Treasury Bond Yield Index (TYX). |

|
| Figure 2. SPX 2015 Daily Chart. |
| Graphic provided by: Yahoo! Finance. |
| |
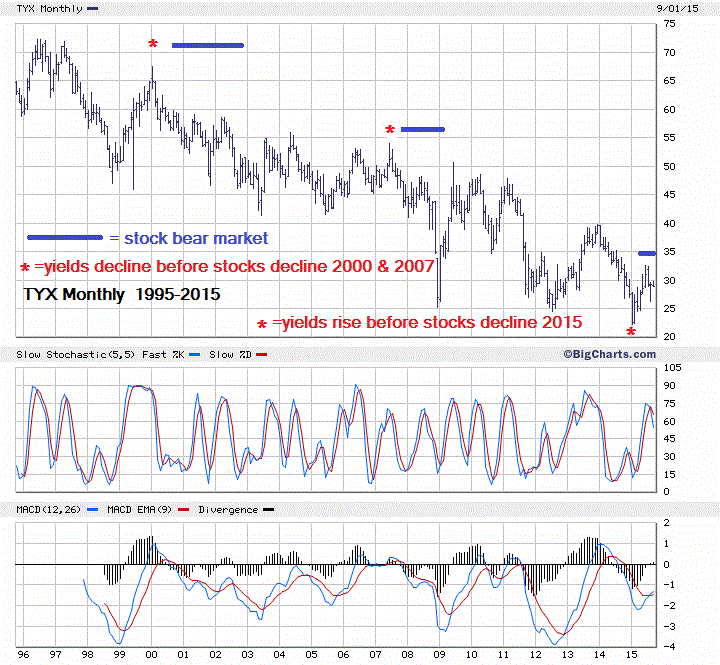
| Interest Rates and Strategy Please see the illustrated chart of the monthly TYX in Figure 4. The TYX has been in a secular bear market since 1981 nearly 34 years ( a Fibonacci number). The new low this year was unconfirmed by both 10 year yields (TNX) and 5 year yields (FVX). Monthly momentum indicators a giving mixed signals. Monthly MACD recently had a bullish crossover. While monthly Stochastic has recently given a bearish crossover. The balance of evidence for yields is tilted to the bullish side because of the recent sharp drop of the DJUA. It's possible a multi decade bull market for yields has begun in 2015. Also note that a few months before the stock market peaks in 2000 and 2007 the TYX began a multi month decline. In 2015 a few months before the major stock indices peaked the TYX began a multi month rally. The economy in China is showing signs of weakness, the recent drop of US stocks implies the US economy could be weakening in coming months. We could be facing the prospect of a slowing economy and rising interest rates. This is something that normally doesn't happen, but understand that after six years of an unprecedented increase in the money supply there could be some unintended consequences. The wild card is what the reaction will be to the FOMC announcement on September 17th . This is why you should exit long positions on September 16th. Even if we knew what the FOMC was going to do it wouldn't help, the reaction of the mass mind to the news is what's important. Positions can be entered on September 18th either on the long or short side depending on the direction. When the SPX was trading around the 2100 area there was enormous evidence indicating that stocks would fall. There's been a decline and the SPX appears headed towards at least 1830-1780. The best traders are the ultimate opportunists, next week could have support hold or break. To be successful we have to be prepared for either scenario. |

|
| Figure 3. Weekly chart of the Dow Jones Utility Average (DJUA). |
| Graphic provided by: BigCharts.com. |
| |

|
| Figure 4. Monthly chart of the Treasury Bond Yield Index (TYX). |
| Graphic provided by: BigCharts.com. |
| |
Independent investment advisor, trader and writer. He has written articles for Technical Analysis of Stocks & Commodities, Traders.com Advantage,Futuresmag.com and, Finance Magnates. Author of website Four Dimension Trading.
| Website: | www.fourdimensiontrading.com |
| E-mail address: | markrivest@gmail.com |
Click here for more information about our publications!
Comments

Request Information From Our Sponsors
- StockCharts.com, Inc.
- Candle Patterns
- Candlestick Charting Explained
- Intermarket Technical Analysis
- John Murphy on Chart Analysis
- John Murphy's Chart Pattern Recognition
- John Murphy's Market Message
- MurphyExplainsMarketAnalysis-Intermarket Analysis
- MurphyExplainsMarketAnalysis-Visual Analysis
- StockCharts.com
- Technical Analysis of the Financial Markets
- The Visual Investor
- VectorVest, Inc.
- Executive Premier Workshop
- One-Day Options Course
- OptionsPro
- Retirement Income Workshop
- Sure-Fire Trading Systems (VectorVest, Inc.)
- Trading as a Business Workshop
- VectorVest 7 EOD
- VectorVest 7 RealTime/IntraDay
- VectorVest AutoTester
- VectorVest Educational Services
- VectorVest OnLine
- VectorVest Options Analyzer
- VectorVest ProGraphics v6.0
- VectorVest ProTrader 7
- VectorVest RealTime Derby Tool
- VectorVest Simulator
- VectorVest Variator
- VectorVest Watchdog
