

HOT TOPICS LIST
- MACD
- Fibonacci
- RSI
- Gann
- ADXR
- Stochastics
- Volume
- Triangles
- Futures
- Cycles
- Volatility
- ZIGZAG
- MESA
- Retracement
- Aroon
INDICATORS LIST
LIST OF TOPICS
PRINT THIS ARTICLE
by Mark Rivest
Is there evidence the trend will continue?
Position: N/A
Mark Rivest
Independent investment advisor, trader and writer. He has written articles for Technical Analysis of Stocks & Commodities, Traders.com Advantage,Futuresmag.com and, Finance Magnates. Author of website Four Dimension Trading.
PRINT THIS ARTICLE
MARKET TIMING
The S&P 500 In 2015 Tracks 2011
09/03/15 09:03:47 AMby Mark Rivest
Is there evidence the trend will continue?
Position: N/A
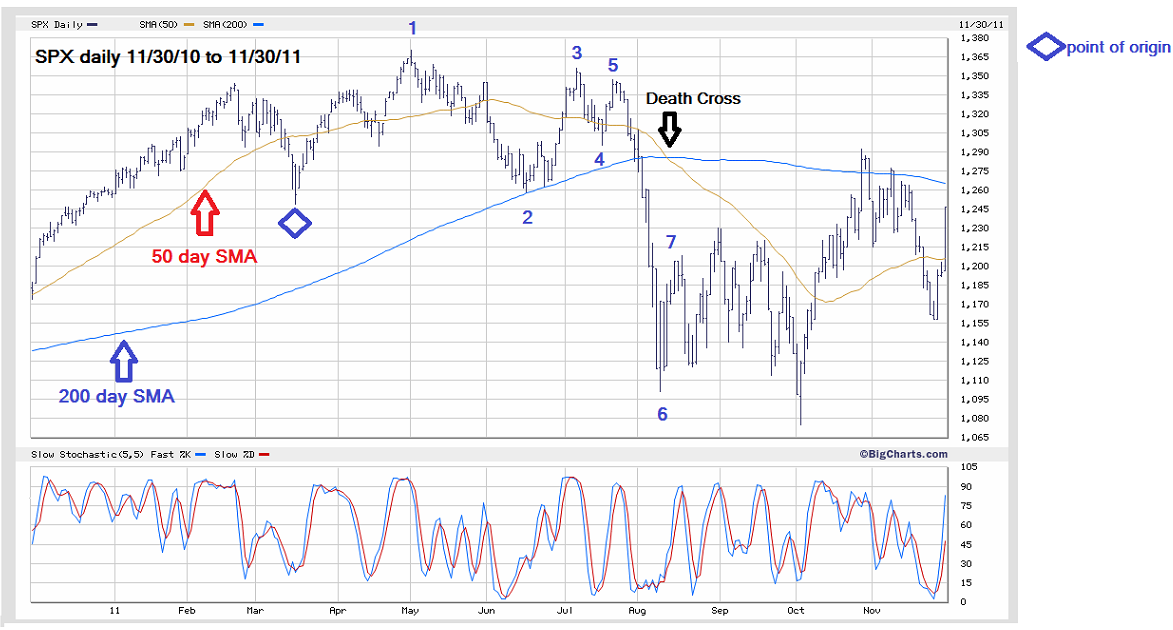
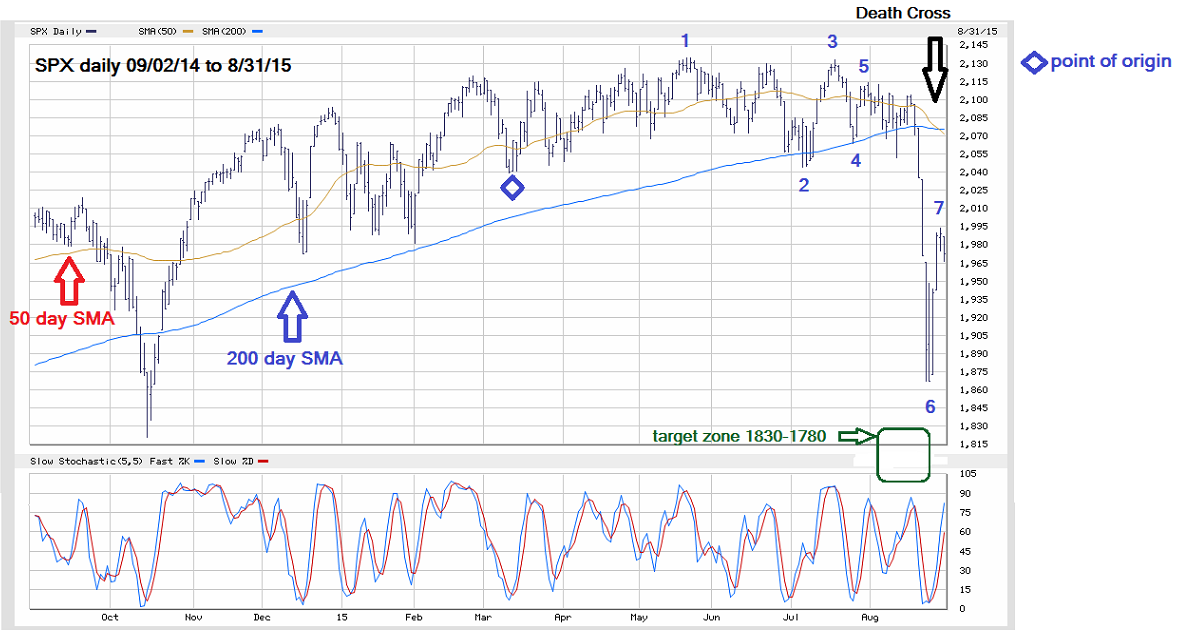
| Since March 11, 2015 the S&P 500 (SPX) has been closely following the path followed in 2011. My August 10, 2015 article "Analyze This" speculated that August 19, 2015 could be a mini crash bottom; just five days later the mini crash bottom occurred. Can this amazing pattern continue? Let's examine the evidence. Momentum Dimension See the illustrated SPX 2011 daily chart in Figure 1 and the illustrated SPX 2015 daily chart in Figure 2. These charts are updates of my August 10, 2015 article which now show a possible seventh point that matches 2011 post-mini crash bounce. Both post crash bounces are for now, about the same number of trading days. What's amazing is that both bounces have come at the time of a "death cross". This momentum indicator has been in the news recently with good reason - it doesn't happen very often. The last time the SPX 50-day simple moving average (SMA) crossed below the 200-day SMA was in 2011. On August 28, 2015 the SPX had an SMA "death cross." In 2011 after the last crossing, designated as point "7" the SPX fell approximately 10%. In 2015 the point "7" close on August 28, 2015 was 1988, and 10% below this level is approximately 1790. This is within the SPX support zone calculated from the October 2014 bottom and the Fibonacci 23.6% retracement level of the bull market that began in 2009. |
|
| Figure 1. 2011 SPX Daily Chart. |
| Graphic provided by: BigCharts.com. |
| |
| Time Dimension The July 31, 2015 full moon coincided with an important SPX peak. In my August 26, 2015 article "Panic Selling" I speculated that Saturday August 29, 2015 full moon could come near the next important bottom. The SPX rallied into a peak on August 28, 2015. Perhaps this could be another important top. If the SPX continues to track the 2011 market it's possible the next significant bottom could come in mid-October. Other candidate time zones are the FOMC meeting on September 17, 2015 and the payroll report on September 4, 2015. Regardless of when it could happen, if the SPX can make it into the support zone of 1830-1780 there's a high probability a buying opportunity could be at hand. |
|
| Figure 2. 2015 SPX Daily Chart |
| Graphic provided by: BigCharts.com. |
| |
| Dow Jones Utility Average My August 21, 2015 article "Dow Utilities Ready For New High?" noted that the Dow Jones Utility Average (DJUA) was moving up while the three main US stock indexes went down. This situation changed after August 24, 2015. On the following trading day, the three main stock indexes held above their August 24, 2015 bottom while the DJUA made a lower low. On the subsequent post crash bounce the DJUA had the weakest rally. The DJUA June 30, 2015 bottom at 548.09 is an important support. Use a break below this level as a sell trigger for utility funds and stocks. If the DJUA breaks below 548.09, one of the possible Elliott wave counts has the DJUA in a third of a third wave down from its all time high. For those unfamiliar with Elliott waves, third of a third waves down are usually very powerful. If the DJUA does have a strong move down, it could have ramifications for the broader stock market. The SPX in 2015 has been on an incredible journey tracing out a close pattern with the 2011 SPX. The next phase of the trek is a move down to major support at 1830-1780. Most traders and investors are probably unaware of the linkage between 2015 and 2011. In the absence of knowledge, emotions take control -- on a break to new 2015 lows the ignorant will be fearful and sell. Those with the knowledge of the 2011 cycle will be calm and ready for what could be the best buying opportunity of the year. |
Independent investment advisor, trader and writer. He has written articles for Technical Analysis of Stocks & Commodities, Traders.com Advantage,Futuresmag.com and, Finance Magnates. Author of website Four Dimension Trading.
| Website: | www.fourdimensiontrading.com |
| E-mail address: | markrivest@gmail.com |
Click here for more information about our publications!
Comments
Date:�09/10/15Rank:�4Comment:�

Request Information From Our Sponsors
- StockCharts.com, Inc.
- Candle Patterns
- Candlestick Charting Explained
- Intermarket Technical Analysis
- John Murphy on Chart Analysis
- John Murphy's Chart Pattern Recognition
- John Murphy's Market Message
- MurphyExplainsMarketAnalysis-Intermarket Analysis
- MurphyExplainsMarketAnalysis-Visual Analysis
- StockCharts.com
- Technical Analysis of the Financial Markets
- The Visual Investor
- VectorVest, Inc.
- Executive Premier Workshop
- One-Day Options Course
- OptionsPro
- Retirement Income Workshop
- Sure-Fire Trading Systems (VectorVest, Inc.)
- Trading as a Business Workshop
- VectorVest 7 EOD
- VectorVest 7 RealTime/IntraDay
- VectorVest AutoTester
- VectorVest Educational Services
- VectorVest OnLine
- VectorVest Options Analyzer
- VectorVest ProGraphics v6.0
- VectorVest ProTrader 7
- VectorVest RealTime Derby Tool
- VectorVest Simulator
- VectorVest Variator
- VectorVest Watchdog