

HOT TOPICS LIST
- MACD
- Fibonacci
- RSI
- Gann
- ADXR
- Stochastics
- Volume
- Triangles
- Futures
- Cycles
- Volatility
- ZIGZAG
- MESA
- Retracement
- Aroon
INDICATORS LIST
LIST OF TOPICS
PRINT THIS ARTICLE
by Mark Rivest
S&P 500 in 2015 traces a similar pattern to that in 2011. Will the result be the same?
Position: N/A
Mark Rivest
Independent investment advisor, trader and writer. He has written articles for Technical Analysis of Stocks & Commodities, Traders.com Advantage,Futuresmag.com and, Finance Magnates. Author of website Four Dimension Trading.
PRINT THIS ARTICLE
MARKET TIMING
Analyze This
08/10/15 02:52:33 PMby Mark Rivest
S&P 500 in 2015 traces a similar pattern to that in 2011. Will the result be the same?
Position: N/A
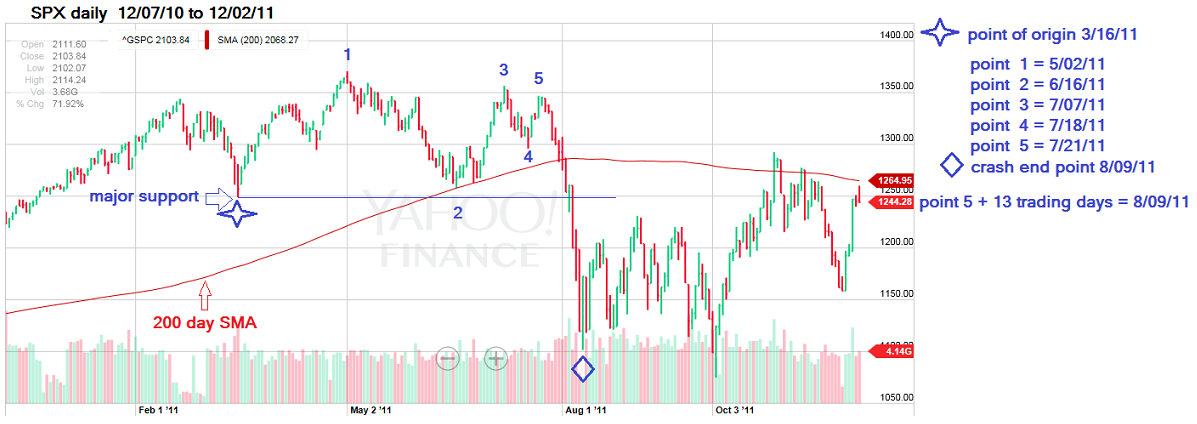
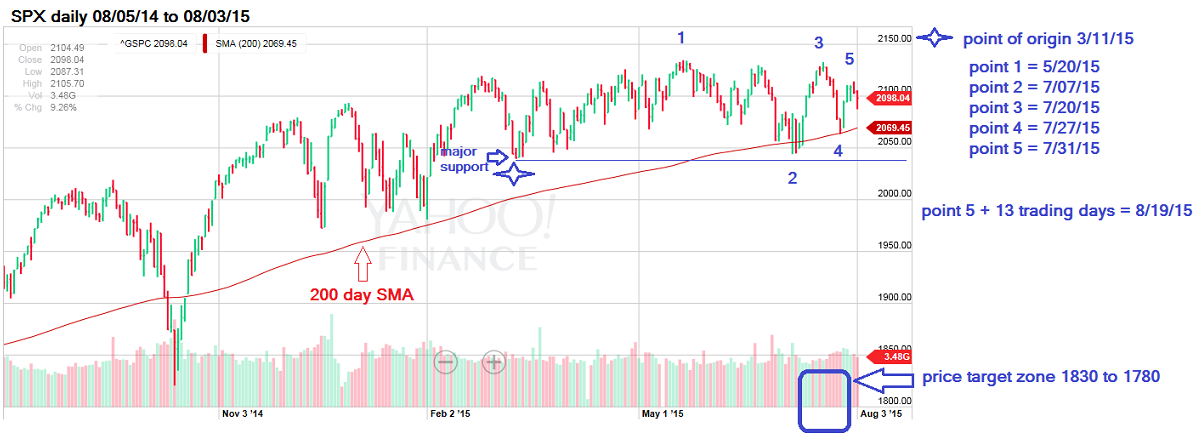
| Since March 2015 the S&P 500 (SPX) has been tracing out an eerily similar pattern to the 2011 SPX peak which resulted in a mini crash. Examination of both markets reveal clues that indicate a repeat mini crash could happen in 2015. Price Dimension Please see the illustrated SPX 2011 daily chart in Figure 1 and the illustrated SPX 2015 daily chart in Figure 2. |
|
| Figure 1: 2011 SPX Daily. S&P 500 daily chart from 2011. |
| Graphic provided by: Yahoo! Finance. |
| |
| From March 16, 2015 - July 21, 2015, the pattern on the SPX 2011 chart looks like an Elliott Wave contracting horizontal triangle in a bear market. Except that it's not. This pattern does not occur at market tops, but the result is the same - a sharp break to the downside. Also note the point of origin of the pattern on March 16, 2011, corresponds with the March 11, 2015 chart support that was illustrated in my May 27, 2015 article "The Battlefield". In that article I explained that this was the bull's main defense line and that a decisive break of that support and the 200-day simple moving average (SMA) could be the start of a move all the way down to the SPX 1820 area. Note what happened in 2011 after a decisive break of the 200-day SMA and the point of origin support. |
|
| Figure 2: 2015 SPX Daily. A current daily chart for the S&P 500. |
| Graphic provided by: Yahoo! Finance. |
| |
| Time Dimension Sometime markets move in increments of Fibonacci numbers, some examples of Fibonacci numbers are 5, 8, 13, 21, 34, 55, 89, and so on. The mini-crash in 2011 from point 5 on July 21, 2015 to the crash bottom on August 8, 2011 was 13 trading days. If the 2015 SPX is repeating the same pattern 13 trading days after the July 31, 2015 top targets August 19, 2015 as a possible 2015 mini-crash bottom. Momentum Dimension In my July 30, 2015 article "A Ludicrous Non-Confirmation" noted that the Shanghai Composite had rallied to just below the first price target zone 4230 to 4310. I thought that this index needed more upside action before the next down leg could begin. As it turned out the Shanghai had a sharp move down immediately after the July 24, 2015 peak. There is a good chance that a zigzag up from the Shanghai crash bottom is complete and the next leg down has begun. A break below the crash bottom could bring a fresh wave of selling worldwide. |
| My July 30, 2015 article noted a Fibonacci time cycle turn due on July 30, 2015 and a full moon on July 31, 2015. The US stock indexes rallied into this time zone with a peak on July 31, 2015. This peak could be the starting point of a 13 trading days mini crash. The 2040 level continues to be the most important on the chart, a breach of which could quickly bring the SPX to the 1830-1780 zone. The SPX has been in a narrow boring trading range for most of the year and that could change in a big way very soon. |
Independent investment advisor, trader and writer. He has written articles for Technical Analysis of Stocks & Commodities, Traders.com Advantage,Futuresmag.com and, Finance Magnates. Author of website Four Dimension Trading.
| Website: | www.fourdimensiontrading.com |
| E-mail address: | markrivest@gmail.com |
Click here for more information about our publications!
Comments
Date:�08/13/15Rank:�3Comment:�

Request Information From Our Sponsors
- StockCharts.com, Inc.
- Candle Patterns
- Candlestick Charting Explained
- Intermarket Technical Analysis
- John Murphy on Chart Analysis
- John Murphy's Chart Pattern Recognition
- John Murphy's Market Message
- MurphyExplainsMarketAnalysis-Intermarket Analysis
- MurphyExplainsMarketAnalysis-Visual Analysis
- StockCharts.com
- Technical Analysis of the Financial Markets
- The Visual Investor
- VectorVest, Inc.
- Executive Premier Workshop
- One-Day Options Course
- OptionsPro
- Retirement Income Workshop
- Sure-Fire Trading Systems (VectorVest, Inc.)
- Trading as a Business Workshop
- VectorVest 7 EOD
- VectorVest 7 RealTime/IntraDay
- VectorVest AutoTester
- VectorVest Educational Services
- VectorVest OnLine
- VectorVest Options Analyzer
- VectorVest ProGraphics v6.0
- VectorVest ProTrader 7
- VectorVest RealTime Derby Tool
- VectorVest Simulator
- VectorVest Variator
- VectorVest Watchdog