HOT TOPICS LIST
- MACD
- Fibonacci
- RSI
- Gann
- ADXR
- Stochastics
- Volume
- Triangles
- Futures
- Cycles
- Volatility
- ZIGZAG
- MESA
- Retracement
- Aroon
INDICATORS LIST
LIST OF TOPICS
PRINT THIS ARTICLE
by Mark Rivest
Here are significant points the stock bulls must hold.
Position: N/A
Mark Rivest
Independent investment advisor, trader and writer. He has written articles for Technical Analysis of Stocks & Commodities, Traders.com Advantage,Futuresmag.com and, Finance Magnates. Author of website Four Dimension Trading.
PRINT THIS ARTICLE
MARKET TIMING
The Battlefield
05/27/15 04:08:17 PMby Mark Rivest
Here are significant points the stock bulls must hold.
Position: N/A
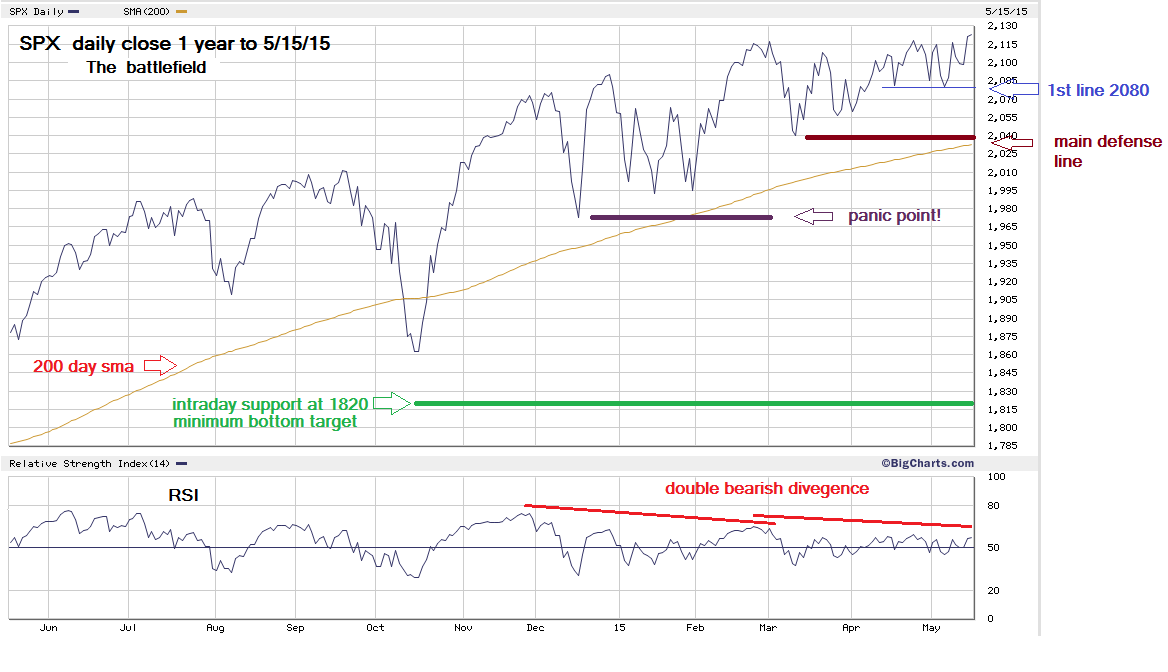
| In warfare, future battlefields can be determined by examining geography and manmade objects. The same is true in market analysis — discovery of where bull & bear battles will take place can be found on any price chart using support & resistance. As in warfare, the side with the greatest strengths will be victorious. Price Dimension The three main US stock indexes — S&P 500 (SPX), Dow Jones Industrial Average (DJIA),and NASDAQ as of May 15, 2015 remain near their highs of the year. SPX is in the vanguard making a new closing high. What would happen if perhaps the SPX declined in the next one to two weeks? Where are the important points that the bulls must hold to keep the uptrend alive? Please see the illustrated daily chart of SPX in Figure 1. |

|
| Figure 1. Daily Chart Of SPX. Here you see the various lines of defense for the SPX. |
| Graphic provided by: BigCharts.com. |
| |
| The SPX daily close one year chart is our map to discovering future bull vs. bear battlegrounds. The first line of defense for the bulls is at the 2080 double bottom. If this support holds, it's just another correction on the road to new highs. If support breaks, the bulls have a much more serious challenge. Note the 200-day simple moving average (SMA) is as of May 15, 2015 at 2033, very close to chart support at 2040. The area of the 200-day SMA and 2040 is the most significant point of the SPX battlefield. A break below both could have tremendous consequences. Not only would two support levels be broken, but for only the fourth time in three years the SPX would be below the 200-day SMA. If this occurs there could be many fund managers thinking the same thing — time to get defensive and sell stocks. Breaking below the main defense line could take the SPX down to 1972, the bottom of the most significant correction since the most recent bull move up started on October 15, 2014. This is the last line of defense for the bulls. A break of this area could cause a selling panic because there's no chart support all the way down to the 1820 intraday low made on October 15, 2014. Consider 1820 as the minimum support zone because as discussed in my April 3, 2015 article "Stock Market Turns Down" the low 1700's could also be a target zone for a bottom. More about this level in a later article if necessary. Momentum and Time Dimensions The SPX's new closing high makes it the strongest of the three main US stock indexes. Let's examine two momentum indicators of the "strongest" index. Please see the illustrated SPX advance/decline line chart in Figure 2. |

|
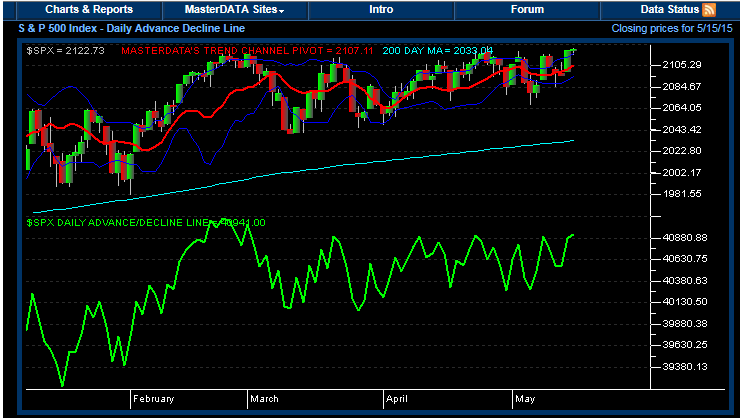
| Figure 2. Daily Chart Of SPX With Advance/Decline Line. The SPX advance/decline line continues to show a bearish divergence with the late February peak. |
| Graphic provided by: MasterDATA. |
| |
| The SPX advance/decline line continues to show a bearish divergence with the late February peak. Please again examine the SPX chart in Figure 1. Note the daily relative strength index (RSI) continues to exhibit a double bearish divergence with the late November peak. The message from both indicators is the exact opposite of what would be expected if the SPX was on the verge of a significant new move up. My April 30, 2015 article had a target date of May 14, 2015 as a possible stock market bottom. The market's ability to hold up near its highs has made this forecast invalid. That forecast was made using the September-October decline of 26 days as a model. Since current conditions are still ripe for a rapid panic decline, 26 days remains as a good tool to determine when a bottom could be made. Assuming the SPX made a peak on May 18, 2015 adding 26 days targets June 13, 2015 a Saturday; nearest trading days are June 12 and June 15, 2015. Occasionally, sharp market declines happen in 55 days which is a Fibonacci number. The Russell 2000 peaked on April 15, 2015 and adding 55 days targets June 9, 2015. Plan of action My April 30, 2015 article, "Precipice", started a theoretical trade with an entry point on the open of trading May 1, 2015 for 1300 shares of Pro Shares Short Russell 2000 (RWM). An entry price of $14.96 with a stop is 6% below entry, which equates to 14.06. Hold. The move of the three main US indexes back up to their highs of the year is an illusion of strength. Momentum has been weak since at least late February. If you're long common stocks or stock indexes use the SPX battlefield map as your guide. A move down in the SPX will bring on battles at the defensive lines. Victory will belong to the stronger side. |
Independent investment advisor, trader and writer. He has written articles for Technical Analysis of Stocks & Commodities, Traders.com Advantage,Futuresmag.com and, Finance Magnates. Author of website Four Dimension Trading.
| Website: | www.fourdimensiontrading.com |
| E-mail address: | markrivest@gmail.com |
Click here for more information about our publications!
Comments

Request Information From Our Sponsors
- VectorVest, Inc.
- Executive Premier Workshop
- One-Day Options Course
- OptionsPro
- Retirement Income Workshop
- Sure-Fire Trading Systems (VectorVest, Inc.)
- Trading as a Business Workshop
- VectorVest 7 EOD
- VectorVest 7 RealTime/IntraDay
- VectorVest AutoTester
- VectorVest Educational Services
- VectorVest OnLine
- VectorVest Options Analyzer
- VectorVest ProGraphics v6.0
- VectorVest ProTrader 7
- VectorVest RealTime Derby Tool
- VectorVest Simulator
- VectorVest Variator
- VectorVest Watchdog
- StockCharts.com, Inc.
- Candle Patterns
- Candlestick Charting Explained
- Intermarket Technical Analysis
- John Murphy on Chart Analysis
- John Murphy's Chart Pattern Recognition
- John Murphy's Market Message
- MurphyExplainsMarketAnalysis-Intermarket Analysis
- MurphyExplainsMarketAnalysis-Visual Analysis
- StockCharts.com
- Technical Analysis of the Financial Markets
- The Visual Investor
