

HOT TOPICS LIST
- MACD
- Fibonacci
- RSI
- Gann
- ADXR
- Stochastics
- Volume
- Triangles
- Futures
- Cycles
- Volatility
- ZIGZAG
- MESA
- Retracement
- Aroon
INDICATORS LIST
LIST OF TOPICS
PRINT THIS ARTICLE
by Mark Rivest
Is it a minor decline or the start of something big?
Position: N/A
Mark Rivest
Independent investment advisor, trader and writer. He has written articles for Technical Analysis of Stocks & Commodities, Traders.com Advantage,Futuresmag.com and, Finance Magnates. Author of website Four Dimension Trading.
PRINT THIS ARTICLE
Stock Market Turns Down
04/03/15 02:23:36 PMby Mark Rivest
Is it a minor decline or the start of something big?
Position: N/A
| March 20, 2015 was the post date of my article, "Turn! Turn! Turn!" A daily chart of the S&P 500 index (SPX) illustrated an Elliott wave, ending diagonal triangle (EDT) forming. A move above the (SPX) February 25, 2015 at 2119.59 was needed to confirm the pattern. On March 23, 2015 the (SPX) came tantalizingly close to confirmation, reaching 2114.86 and then declined. What's happening? Is the EDT pattern still under construction? If so, we can soon expect another rally that will move above 2119.59. Or is the drop from 2114.86 the prelude to a much larger decline? |
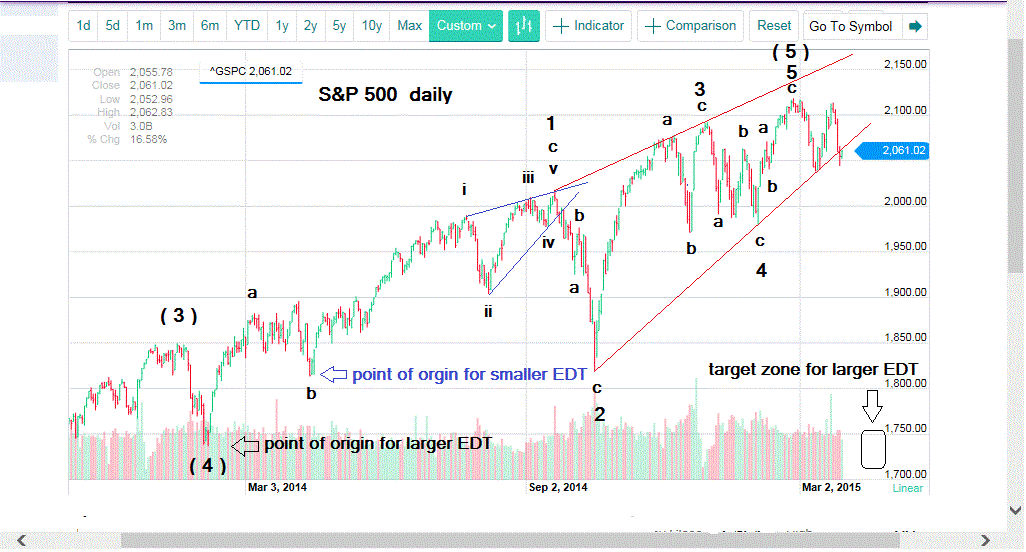
| Price Dimension For those of you new or unfamiliar to Elliott Wave analysis, there are always alternative counts. No matter how certain a pattern may look, there is an alternate path to take. Any market is a mass mind and like an individual mind it can change direction at any moment. Please see the illustrated (SPX) daily chart in Figure 1. Ending diagonal triangles are a special type of Elliott wave pattern. They occur primarily in fifth waves and occasionally in 'C' waves. The fourth wave almost always overlaps into the price area of wave 1. They are also the only Elliott pattern in which each of the impulse waves - 1, 3, and 5 subdivides into three waves instead of the normal five. |
|
| Figure 1. Daily Chart Of S&P 500 Index. Ending diagonal triangles occur primarily in fifth waves and occasionally in 'C' waves. The fourth wave almost always overlaps into the price area of wave 1. They are also the only Elliott pattern in which each of the impulse waves subdivides into three waves instead of the normal five. |
| Graphic provided by: Yahoo! Finance. |
| |
| For the (SPX) pattern that began in February 2014 within the first and third wave you can differentiate between sub waves 'A', 'B' and 'C'. Sometimes when a market moves fast, the intervening wave 'B' doesn't have much time to form. This may have been what happened during the February 2, 2015 to February 25, 2015 rally. It is also possible that the March 11, 2015 to March 23, 2015 rally was a rare truncated wave 'C', where wave 'C' fails to exceed the termination point of wave 'A'. In either case the message is the same. The EDT that began on February 5, 2014 can be counted as complete. There is another interesting characteristic of EDT patterns. After completion of a rising EDT the decline is very sharp at least to the level of the point of origin. Again please refer to the illustrated daily chart of the SPX. Wave 'C' of '1' of the larger EDT pattern that began on February 5, 2014 is also an EDT. Wave 'C' of '1' begins April 11, 2014 at (SPX) 1814.36, rallies to a peak at 2019.26 on September 19, 2014, then drops like a rock to 1820.66 on October 15, 2014. That's a mere 3/10 of one percent from the point of origin. Incredible! If the EDT pattern from February 5, 2014 is complete, the bulls-eye target for the subsequent collapse is the point of origin of the SPX at 1737.92. Next you need to find if there are any nearby Fibonacci support levels. The first level to examine is the entire bull market from March 2009. The (SPX) high so far is 2119 - 666 (low of the last bear market) = 1453 x .236 = 342. 2119 - 342 = 1777. Consider this a secondary target because there is another Fibonacci calculation even closer to the EDT point of origin. Using the October 2011 intermediate bottom of 1074, the calculation is 2119 - 1074 = 1045 x .382 = 399. 2119 - 399 = 1720 only 17 points from the bulls-eye target. |
| Time Dimension Occasionally total solar eclipses will occur at or near market turns. The last time this happened was the total solar eclipse on November 13, 2012. On the November 16, 2012 all three major US stock indices made a intermediate bottom. On March 20, 2015 there was a total solar eclipse, the same day as the NASDAQ (COMP) 2015 high. The smaller (EDT) April 11, 2014 to September 19, 2014, 162 days. The subsequent decline lasted 26 days. A ratio of 26/162 = .16. The larger (EDT) February 5, 2014 to February 25, 2015 , 386 days x .16 = 61 days. Add this to February 25, 2015 = April 27, 2015. A complication to the time forecast is that all three main US stock indices made separate peaks in the February to March time frame. The bottoming could last until late May. |
| Summary My March 20, 2015 report stated the SPX and DJIA were in the zone of major Fibonacci price resistance. March 2015 is at a critical Fibonacci time ratio. Sentiment and momentum bearish divergences have been occurring for months. Now we even have bearish divergences among the three main US stock indexes. The bull market is weak and out of time. To keep score, I'm starting a theoretical trade. The day after this article is posted, 9:30 AM EDT will be the starting point for long 1000 shares of Pro Shares Short S&P 500 (SH). This is assuming the shares are trading above the low of the year at 21.00. The stop is at 20.95 If the stock market has a sharp decline, there will be a reason in the "news" as to why the market is falling. Will trading off this "news" be of any benefit? Further reading: Frost,AJ and Robert Prechter (1985) "Elliott Wave Principle", New Classics Library. |
Independent investment advisor, trader and writer. He has written articles for Technical Analysis of Stocks & Commodities, Traders.com Advantage,Futuresmag.com and, Finance Magnates. Author of website Four Dimension Trading.
| Website: | www.fourdimensiontrading.com |
| E-mail address: | markrivest@gmail.com |
Click here for more information about our publications!
Comments
Date:�11/19/15Rank:�5Comment:�lela.karaulashvili@rambler.ru

Request Information From Our Sponsors
- StockCharts.com, Inc.
- Candle Patterns
- Candlestick Charting Explained
- Intermarket Technical Analysis
- John Murphy on Chart Analysis
- John Murphy's Chart Pattern Recognition
- John Murphy's Market Message
- MurphyExplainsMarketAnalysis-Intermarket Analysis
- MurphyExplainsMarketAnalysis-Visual Analysis
- StockCharts.com
- Technical Analysis of the Financial Markets
- The Visual Investor
- VectorVest, Inc.
- Executive Premier Workshop
- One-Day Options Course
- OptionsPro
- Retirement Income Workshop
- Sure-Fire Trading Systems (VectorVest, Inc.)
- Trading as a Business Workshop
- VectorVest 7 EOD
- VectorVest 7 RealTime/IntraDay
- VectorVest AutoTester
- VectorVest Educational Services
- VectorVest OnLine
- VectorVest Options Analyzer
- VectorVest ProGraphics v6.0
- VectorVest ProTrader 7
- VectorVest RealTime Derby Tool
- VectorVest Simulator
- VectorVest Variator
- VectorVest Watchdog