

HOT TOPICS LIST
- MACD
- Fibonacci
- RSI
- Gann
- ADXR
- Stochastics
- Volume
- Triangles
- Futures
- Cycles
- Volatility
- ZIGZAG
- MESA
- Retracement
- Aroon
INDICATORS LIST
LIST OF TOPICS
PRINT THIS ARTICLE
by Mark Rivest
Could an ending diagonal triangle signal a change in seasons?
Position: N/A
Mark Rivest
Independent investment advisor, trader and writer. He has written articles for Technical Analysis of Stocks & Commodities, Traders.com Advantage,Futuresmag.com and, Finance Magnates. Author of website Four Dimension Trading.
PRINT THIS ARTICLE
Turn! Turn! Turn!
03/20/15 04:04:44 PMby Mark Rivest
Could an ending diagonal triangle signal a change in seasons?
Position: N/A
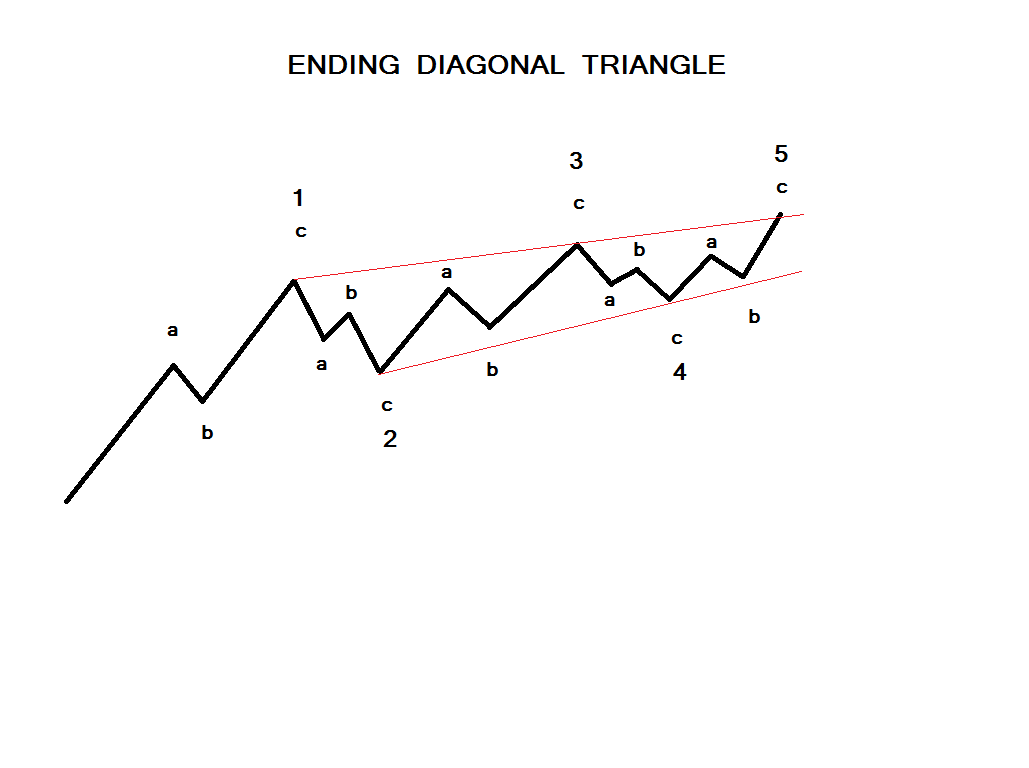
That's the opening of the classic 1965 hit song by the Byrds "To Everything There Is A Season." This could also be the theme song for what could be happening in the current US stock market. For more than a year a possible Elliott wave ending diagonal triangle (Figure 1) may have been forming. If that is the case, then when it is complete, its implications could mean a change of seasons from bull to a bear market. Time Dimension In the 2015 Bonus issue of Technical Analysis of STOCKS & COMMODITIES my article "The US Long Wave" has a long-term Fibonacci time ratio using the Dow Jones Industrial Average (DJIA) peak of January 14, 2000 and the bottom of March 6, 2009 that targeted October 30, 2014 as a bullseye date for a possible turn. The subsequent rally peak made on December 26, 2014 was within the leeway for a time ratio using multi-year components. When the (DJIA) on February 20, 2015 moved above the December 26, 2014 top, it invalidated the significance of the late 2014 time ratio. Normally when a long-term ratio is breached, the next long-term price ratio can be several months or even years in the future. In this case we don't have to wait very long. The (DJIA) bear market from October 2007 to March 2009 was 17 months long. The (DJIA) bull market from March 2009 to March 2015 is 72 months long. 17/72 = .236 — a Fibonacci ratio. Also of interest is that 17 is 50% of Fibonacci number 34 and 72 is 50% of 144, which is another Fibonacci number. The number of calendar days from October 11, 2007 peak to March 6, 2009 bottom is 513, divided by .236 = 2174 calendar days; add this to the March 6, 2009 bottom and it targets February 17, 2015. Any (DJIA) peak made in March 2015 would be within the leeway for a time cycle of this size. |
|
| Figure 1. Ending Diagonal Triangle. Here you see a typical illustration of an ending diagonal triangle. |
| Graphic provided by: N/A. |
| |
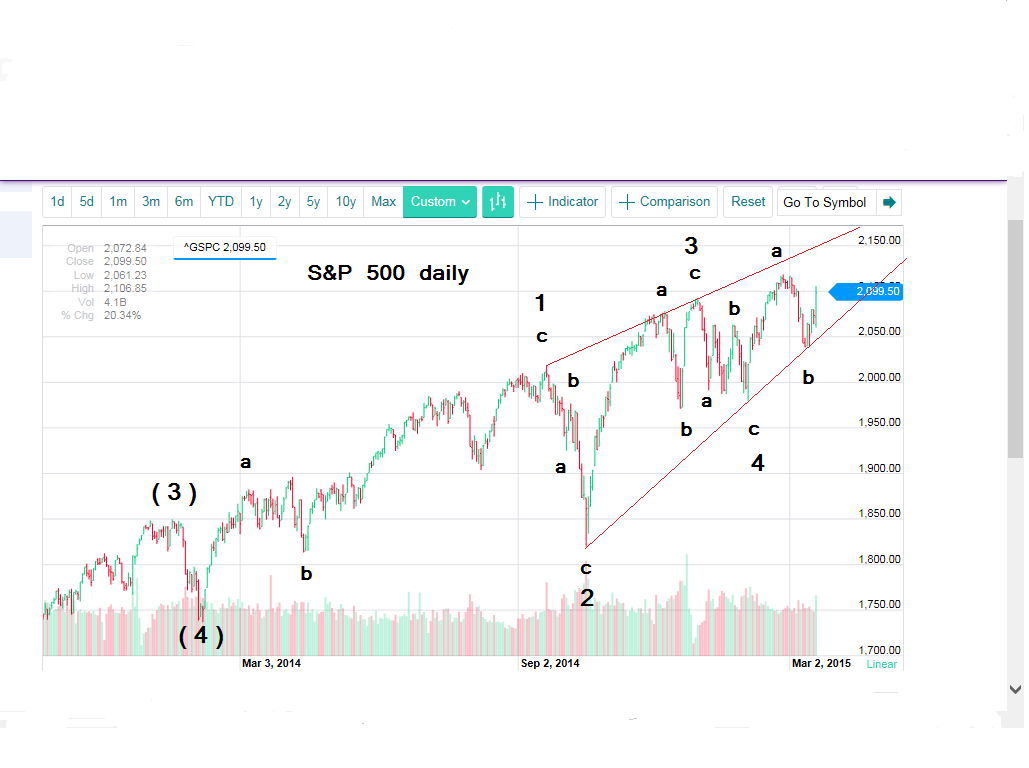
| Price Dimension At of the December 2014 peak the (DJIA) has a Fibonacci price ratio of 1.5. Compare the bull market of March 2009 to December 2014 with the bear market of October 2007 to March 2009. In (DJIA) points its 11592/7728 = 1.5 As of the March 2, 2015 peak the ratio is now 1.529 which is within leeway for the 1.5 ratio; this is another fascinating (DJIA) ratio. The January 2000 to October 2002 bear market was 4553 points. The October 2002 to October 2007 bull market was 7001 points. The ratio is 7001/4553 = 1.537, nearly equal to the current bull/bear ratio. Incredible! The S&P 500 (SPX) is also near a significant Fibonacci price ratio. The October 2007 to March 2009 bear market was 909 points. The bull market from March 2009 to February 25, 2015 is 1453 points, 1453/909 = 1.598, which is close to the Fibonacci ratio of 1.618. In addition to the powerful Fibonacci evidence the SPX appears to be forming an ending diagonal triangle (EDT) as you can see in Figure 2. This is a special type of Elliott wave that occurs primarily in fifth wave positions and are termination points of larger patterns. While most EDT's throw over the upper trend line, it is not necessary. A move above SPX 2119.59 will confirm the pattern illustrated. |
|
| Figure 2. Fibonacci And Ending Diagonal Triangle On The S&P 500 Index. This type of price movement usually occurs in fifth wave positions and are termination points of larger patterns. |
| Graphic provided by: Yahoo! Finance. |
| |
| Summary "The US Long Wave" noted multiple momentum and sentiment divergences at the December 2014 peak. These divergence are still in place at the marginally higher March 2015 top. The Fibonacci time zone targets March 2015. The DJIA and SPX are close to Fibonacci price targets. Bullseye target for the SPX 1.618 ratio is 2138.03. Powerful evidence in all four market dimensions is rare and strongly suggests a major turn is at hand. At the end of "To Everything There is a Season" there's a line — A time to gain, a time to lose. Very appropriate for what may happen in a few days. A time to gain for those that act on the bearish evidence. If you ignore the evidence, it's a time to lose. The choice is yours. It's not too late! |
Independent investment advisor, trader and writer. He has written articles for Technical Analysis of Stocks & Commodities, Traders.com Advantage,Futuresmag.com and, Finance Magnates. Author of website Four Dimension Trading.
| Website: | www.fourdimensiontrading.com |
| E-mail address: | markrivest@gmail.com |
Click here for more information about our publications!
Comments
Date:�03/23/15Rank:�4Comment:�

Request Information From Our Sponsors
- StockCharts.com, Inc.
- Candle Patterns
- Candlestick Charting Explained
- Intermarket Technical Analysis
- John Murphy on Chart Analysis
- John Murphy's Chart Pattern Recognition
- John Murphy's Market Message
- MurphyExplainsMarketAnalysis-Intermarket Analysis
- MurphyExplainsMarketAnalysis-Visual Analysis
- StockCharts.com
- Technical Analysis of the Financial Markets
- The Visual Investor
- VectorVest, Inc.
- Executive Premier Workshop
- One-Day Options Course
- OptionsPro
- Retirement Income Workshop
- Sure-Fire Trading Systems (VectorVest, Inc.)
- Trading as a Business Workshop
- VectorVest 7 EOD
- VectorVest 7 RealTime/IntraDay
- VectorVest AutoTester
- VectorVest Educational Services
- VectorVest OnLine
- VectorVest Options Analyzer
- VectorVest ProGraphics v6.0
- VectorVest ProTrader 7
- VectorVest RealTime Derby Tool
- VectorVest Simulator
- VectorVest Variator
- VectorVest Watchdog