

HOT TOPICS LIST
- MACD
- Fibonacci
- RSI
- Gann
- ADXR
- Stochastics
- Volume
- Triangles
- Futures
- Cycles
- Volatility
- ZIGZAG
- MESA
- Retracement
- Aroon
INDICATORS LIST
LIST OF TOPICS
PRINT THIS ARTICLE
by Mark Rivest
Bull market clings to life, as some stock indexes break resistance on atrocious momentum.
Position: N/A
Mark Rivest
Independent investment advisor, trader and writer. He has written articles for Technical Analysis of Stocks & Commodities, Traders.com Advantage,Futuresmag.com and, Finance Magnates. Author of website Four Dimension Trading.
PRINT THIS ARTICLE
MARKET TIMING
Precipice
04/30/15 04:25:36 PMby Mark Rivest
Bull market clings to life, as some stock indexes break resistance on atrocious momentum.
Position: N/A
| On April 23, 2015 the S&P 500 and Nasdaq Composite moved to new bull market highs. While near term this implies more upside action, there are many factors indicating any further gains could be limited. There is a tremendous amount of evidence that a sharp decline maybe coming soon. US stock indexes could be at a precipice. |
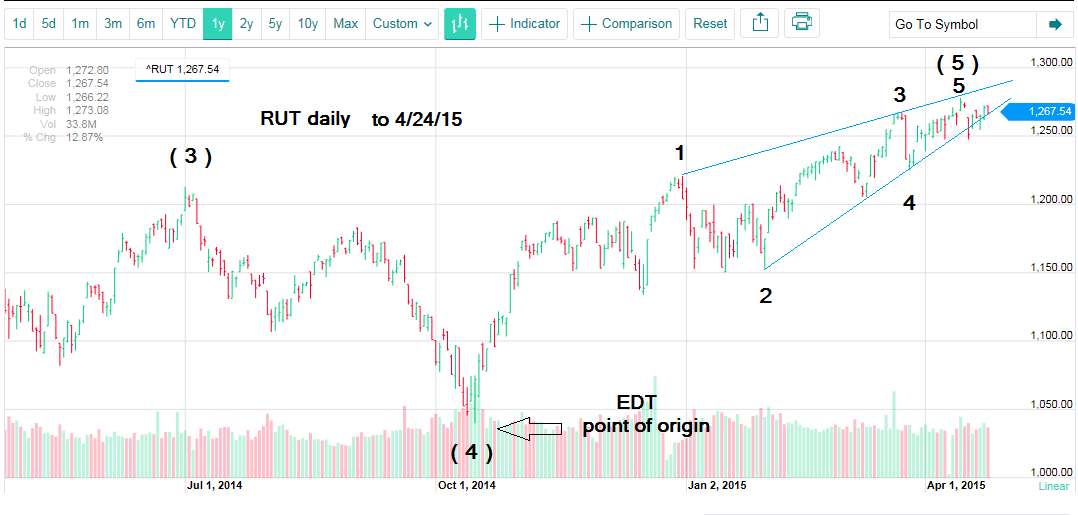
| Momentum and Price Dimensions The SPX gains as of the close on April 24, 2015 have been marginal. The SPX advance/decline line has a bearish divergence compared to the peak made on February 25, 2015. As for stocks within the SPX making new 52-week highs, there is a huge bearish divergence compared to the peak made on November 28, 2014. The Nasdaq Composite had a sizable gain on the break out. Yet on April 24, 2015 declining stocks led winners by a seven to five ratio! The Dow Jones Industrial Average (DJIA) has yet to break above its March 23, 2015 high, let alone the high for the year. Yes, this is still a bull market. A very sick bull market. The March 20, 2015 "Turn! Turn! Turn!" article stated the DJIA was close to a major Fibonacci ratio. With the DJIA still below its March 2, 2015 peak that Fibonacci resistance is still valid. The S&P 500 has so far reached 2120.92 only a mere 17.11 points from the bulls eye target of 2138.03. The Nasdaq is also close to a Fibonacci ratio of 1/1 with the 2000 to 2002 bear market. As of the April 24, 2015 high at 5100.37, it only has to rise another 32.15 points for a bulls eye hit. Weak momentum with all three US main stock indexes in the territory of major Fibonacci resistance is a toxic combination for the bull market. If that's not enough, the Russell 2000 (RUT) appears to have formed an ending diagonal triangle (EDT) from the October 15, 2014 bottom. Please read my detailed discussion of EDTs in the April 3rd article "Stock Market Turns Down" and see the illustrated RUT daily chart in Figure 1. |
|
| Figure 1. Daily Chart Of The Russell 2000 (RUT). The index appears to have formed an ending diagonal triangle (EDT) from the October 15, 2014 bottom. |
| Graphic provided by: Yahoo! Finance. |
| |
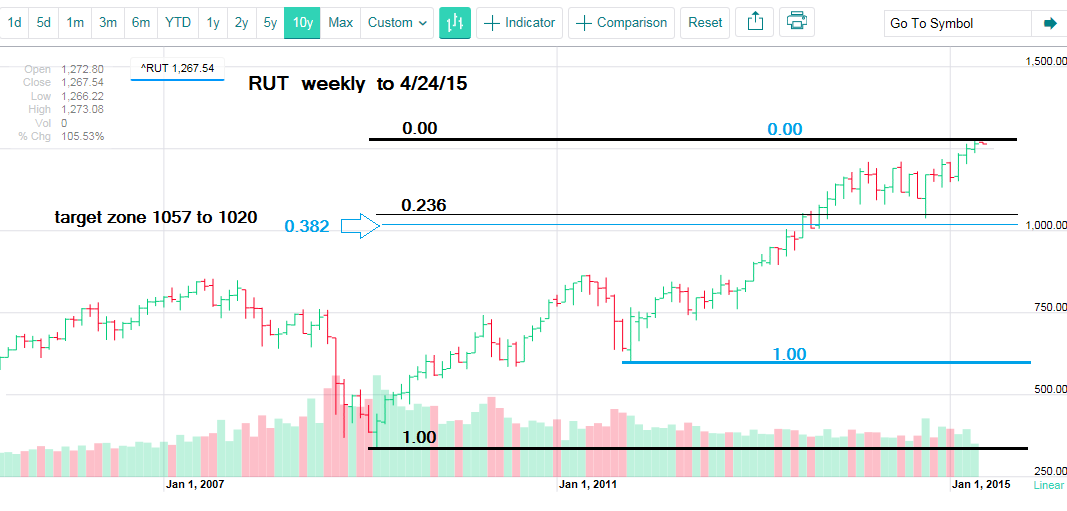
| After completion of a rising EDT the decline is sharp at least to the point of origin, which in this case is RUT 1040.47. Please see the illustrated RUT weekly chart in Figure 2. To determine Fibonacci support levels, I used the same levels chosen for the SPX as in the April 3, 2015 article. These levels are the March 2009 bear market bottom and the October 2011 intermediate bottom. The precise point using the 2009 bottom is RUT 1057.73. The precise point from the 2011 bottom is RUT 1020.05. This is a much tighter bracket than even the SPX price zone. RUT 1020 to 1057 is a powerful support zone. |
|
| Figure 2. Weekly Chart Of RUT. Here you see the Fibonacci support levels. |
| Graphic provided by: Yahoo! Finance. |
| |
| Note that there is an alternate count for the SPX in which this index may have also formed an EDT from the October 15, 2014 bottom. If so, it could raise the support levels for the SPX discussed in the April 3, 2015 article. More about this later if necessary. Time Dimension Because the RUT has the most definitive EDT pattern, it's the best index to formulate a time forecast. My April 3, 2015 article noted the S&P 500 had an EDT from April 11, 2014 to September 19, 2014. This pattern measured 162 days, the post EDT collapse was 26 days, which is a ratio of 26/162 = .16 Assuming the RUT April 15, 2015 peak holds, the RUT potential EDT is almost the same length at 183 days. Multiply 183 days by .16 = 29 days added to the April 15 peak targets May 14, 2015. If the RUT were to exceed the April 15 peak, the forecast would be pushed further into the future. Conclusion My April 3, 2015 article started a theoretical trade with an entry point on the open of trading on April 6, 2015 for 1000 shares of Pro Shares Short S&P 500 (SH). The stop at 20.95 was hit resulting in a 3% loss. Because of the overwhelming bearish evidence, a theoretical trade for 1300 shares of Pro Shares Short Russell 2000 (RWM) will begin at 9:30 AM EDT the day after this article is posted. The stop is 6% below entry. You want to short weak stocks or indexes because they generally will decline the most. RUT is now weaker than the S&P 500. Markets can be tricksters. They can give many signals of a direction change and not change direction. In the process they fake out many traders. Strong evidence points to a sharp decline into May. The stock market could be at the precipice. |
Independent investment advisor, trader and writer. He has written articles for Technical Analysis of Stocks & Commodities, Traders.com Advantage,Futuresmag.com and, Finance Magnates. Author of website Four Dimension Trading.
| Website: | www.fourdimensiontrading.com |
| E-mail address: | markrivest@gmail.com |
Click here for more information about our publications!
Comments

Request Information From Our Sponsors
- StockCharts.com, Inc.
- Candle Patterns
- Candlestick Charting Explained
- Intermarket Technical Analysis
- John Murphy on Chart Analysis
- John Murphy's Chart Pattern Recognition
- John Murphy's Market Message
- MurphyExplainsMarketAnalysis-Intermarket Analysis
- MurphyExplainsMarketAnalysis-Visual Analysis
- StockCharts.com
- Technical Analysis of the Financial Markets
- The Visual Investor
- VectorVest, Inc.
- Executive Premier Workshop
- One-Day Options Course
- OptionsPro
- Retirement Income Workshop
- Sure-Fire Trading Systems (VectorVest, Inc.)
- Trading as a Business Workshop
- VectorVest 7 EOD
- VectorVest 7 RealTime/IntraDay
- VectorVest AutoTester
- VectorVest Educational Services
- VectorVest OnLine
- VectorVest Options Analyzer
- VectorVest ProGraphics v6.0
- VectorVest ProTrader 7
- VectorVest RealTime Derby Tool
- VectorVest Simulator
- VectorVest Variator
- VectorVest Watchdog