

HOT TOPICS LIST
- MACD
- Fibonacci
- RSI
- Gann
- ADXR
- Stochastics
- Volume
- Triangles
- Futures
- Cycles
- Volatility
- ZIGZAG
- MESA
- Retracement
- Aroon
INDICATORS LIST
LIST OF TOPICS
PRINT THIS ARTICLE
by Mark Rivest
Is the Nasdaq's move to new highs a sign of weakness for stocks?
Position: N/A
Mark Rivest
Independent investment advisor, trader and writer. He has written articles for Technical Analysis of Stocks & Commodities, Traders.com Advantage,Futuresmag.com and, Finance Magnates. Author of website Four Dimension Trading.
PRINT THIS ARTICLE
MARKET TIMING
A Ludicrous Non-Confirmation
07/30/15 04:39:09 PMby Mark Rivest
Is the Nasdaq's move to new highs a sign of weakness for stocks?
Position: N/A
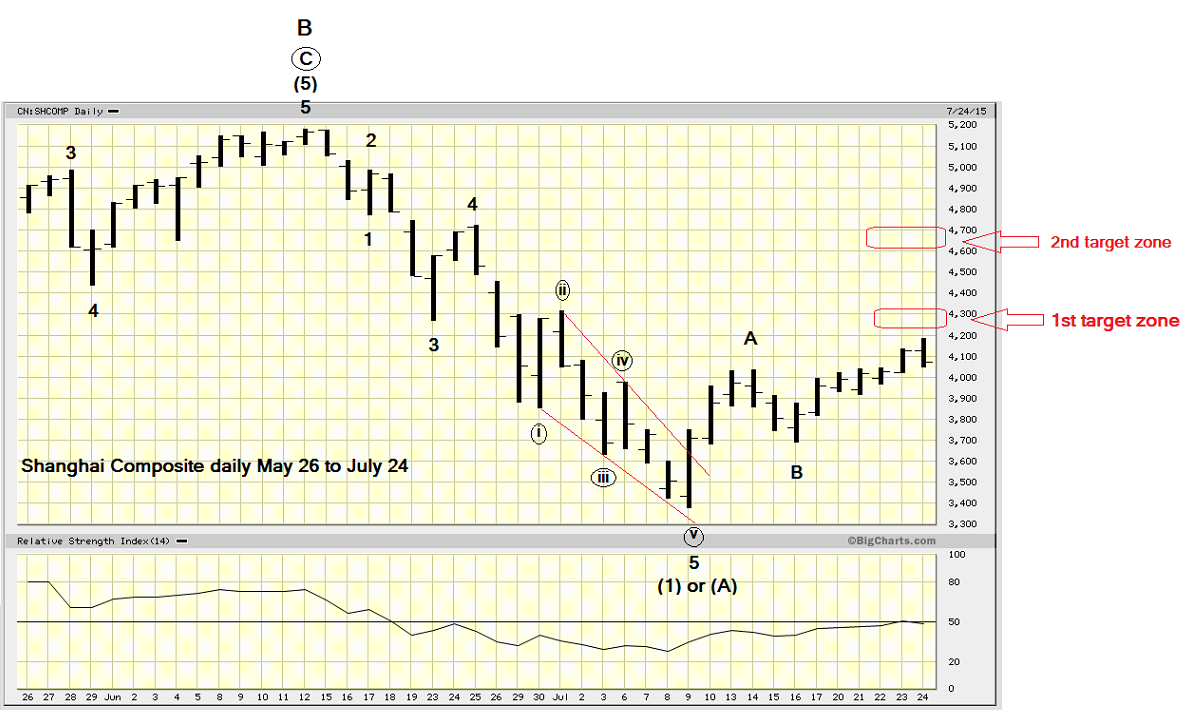
| So far the Nasdaq's July move to new highs has been unconfirmed by nearly every other stock index. This along with clues from three other stock indexes; S&P 500 (SPX), Dow Jones Industrial Average (DJIA), and the Shanghai Composite indicate that a sharp move down in US stocks has begun. Price Dimension My July 17, 2015 article "Battle Line" discussed a tight cluster of three Fibonacci coordinates in the SPX 2100-2101 area. This supposed barrier proved to be no resistance, as the SPX broke above this zone like a hot knife through butter. Typically when a market breaks a Fibonacci barrier it will gravitate to the next zone, which in this case is 2138.03 the major Fibonacci point discussed in my June 8, 2015 article "Golden Section". There is also another Fibonacci coordinate at SPX 2134.82, the high so far this year. On July 20, 2015 the SPX reached 2132.82 only 1.90 points from the high of the year and 5.21 points from the major Fibonacci point. The SPX then took a decisive turn down. At least for now this Fibonacci barrier has held, I suspect it could hold for many years. Please see the illustrated Shanghai Composite daily chart in Figure 1. |
|
| Figure 1. Shanghai Composite Index (SSEC) Daily Chart. |
| Graphic provided by: BigCharts.com. |
| |
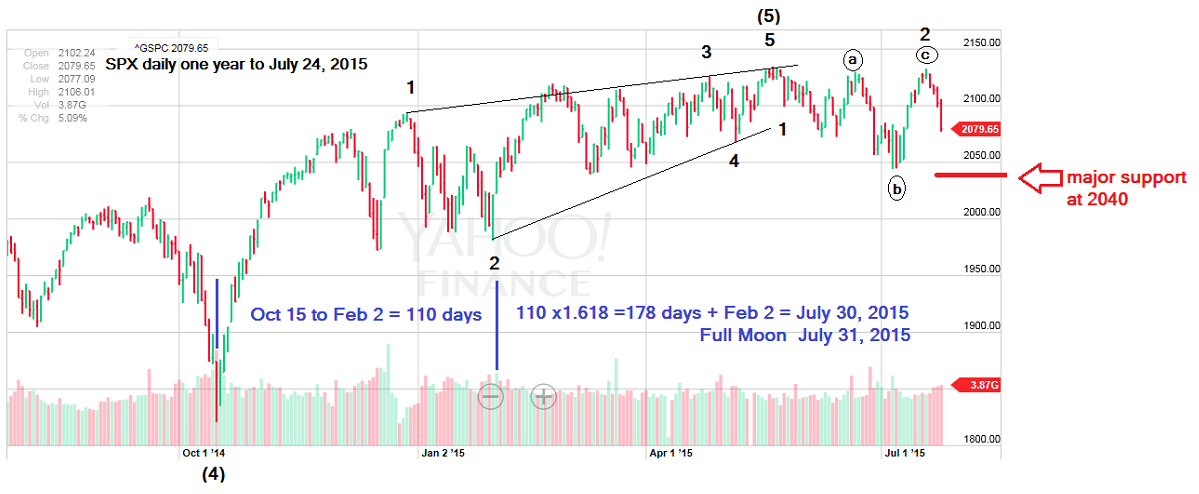
| My article "China Leads the Way" discussed the importance of the Shanghai Composite. So far this index has formed a single zigzag pattern from the crash bottom. While this could be the completion of the correction, the Shanghai Composite is still below the first resistance zone. Also, the weekly stochastic (not shown) has only marginally moved up from its low. The Shanghai Composite looks like it needs more upside action before the next down leg can begin. Continue to watch the Shanghai Composite. Momentum Dimension In the 1987 classic Mel Brooks comedy move "Spaceballs" the evil Dark Helmet played by Rick Moranis orders his starship to Ludicrous speed, which leads to hilarious results. The Nasdaq July 2015 ludicrous non-confirmation to new highs may not be a laughing matter for the stock bulls. The Nasdaq high was unconfirmed by the other two main US stock indexes - SPX and DJIA. Also, not confirming the new high were the S&P 400 mid-cap stocks, and the Russell 2000 small-cap stocks. And if that wasn't enough, no other major international stock index confirmed the high. Even the Nikkei 225 held below its June peak. Years from now this ludicrous non-confirmation could be viewed as a classic sign of a major stock market peak. Time Dimension and a Plan Please see the illustrated SPX daily chart in Figure 2. |
|
| Figure 2. S&P 500 (SPX) Daily Chart. |
| Graphic provided by: Yahoo! Finance. |
| |
| There's a Fibonacci time cycle turn due on July 30, 2015 and July 31, 2015 is a full moon. Markets will occasionally turn on new or full moons. This time cycle could be either a peak or a bottom. If the SPX is rallying into late July-early August it could be a gift to short sellers. The daily SPX chart illustrates the primary wave count. A small wave 1 down from the high of 2015, followed by an elaborate expanding flat wave 2 up into the July 20, 2015 peak. The alternate bullish wave count (not shown) is our old friend the ending diagonal triangle (EDT) up from the October 2014 bottom. Yes, this wave count could still be alive - it's like an EDT that never ends. But every pattern does end and this wave count will be eliminated on an SPX break below the July 7, 2015 low, the supposed wave 4 of the EDT at 2044.02. As of July 24, 2015 the SPX had retraced 62% of the July 7 - July 20 rally. However the DJIA, which can also be counted as an EDT from October 2014 has retraced 86% of same rally. The DJIA supposed EDT wave 4 is its July 7, 2015 bottom. A DJIA break below the July 7, 2015 bottom would significantly reduce the chances of the SPX, or any other stock index to move above the 2015 peaks. Here's the plan - short any multi-day rally during the late July-early August time zone. If you're shorting indexes use a 67% retrace of any decline from the 2015 highs as a stop loss point. It has been difficult to trade the bearish side of the US stock market. In spite of overwhelming bearish evidence the declines have been small. Now's not the time to give up on a bearish stance. A break below SPX 2040 could lead to fund managers panicking, taking the index to the October 2014 bottom in just a few weeks. The tagline for "Spaceballs" was, "May the Schwartz be with you". In this case it would be, "May the shorts be with you". |
Independent investment advisor, trader and writer. He has written articles for Technical Analysis of Stocks & Commodities, Traders.com Advantage,Futuresmag.com and, Finance Magnates. Author of website Four Dimension Trading.
| Website: | www.fourdimensiontrading.com |
| E-mail address: | markrivest@gmail.com |
Click here for more information about our publications!
Comments
Date:�08/15/15Rank:�5Comment:�

Request Information From Our Sponsors
- StockCharts.com, Inc.
- Candle Patterns
- Candlestick Charting Explained
- Intermarket Technical Analysis
- John Murphy on Chart Analysis
- John Murphy's Chart Pattern Recognition
- John Murphy's Market Message
- MurphyExplainsMarketAnalysis-Intermarket Analysis
- MurphyExplainsMarketAnalysis-Visual Analysis
- StockCharts.com
- Technical Analysis of the Financial Markets
- The Visual Investor
- VectorVest, Inc.
- Executive Premier Workshop
- One-Day Options Course
- OptionsPro
- Retirement Income Workshop
- Sure-Fire Trading Systems (VectorVest, Inc.)
- Trading as a Business Workshop
- VectorVest 7 EOD
- VectorVest 7 RealTime/IntraDay
- VectorVest AutoTester
- VectorVest Educational Services
- VectorVest OnLine
- VectorVest Options Analyzer
- VectorVest ProGraphics v6.0
- VectorVest ProTrader 7
- VectorVest RealTime Derby Tool
- VectorVest Simulator
- VectorVest Variator
- VectorVest Watchdog