

HOT TOPICS LIST
- MACD
- Fibonacci
- RSI
- Gann
- ADXR
- Stochastics
- Volume
- Triangles
- Futures
- Cycles
- Volatility
- ZIGZAG
- MESA
- Retracement
- Aroon
INDICATORS LIST
LIST OF TOPICS
PRINT THIS ARTICLE
by Mark Rivest
Stock bulls hold important support.
Position: N/A
Mark Rivest
Independent investment advisor, trader and writer. He has written articles for Technical Analysis of Stocks & Commodities, Traders.com Advantage,Futuresmag.com and, Finance Magnates. Author of website Four Dimension Trading.
PRINT THIS ARTICLE
SUPPORT & RESISTANCE
Battle Line
07/17/15 02:08:52 PMby Mark Rivest
Stock bulls hold important support.
Position: N/A
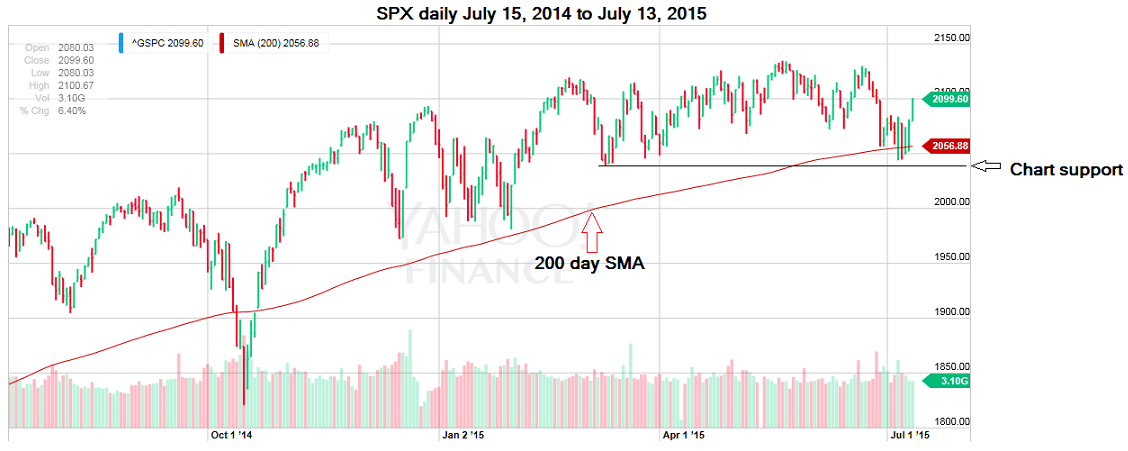
| A titanic battle was waged at the S&P 500 (SPX) 200-day simple moving average (SMA) and SPX chart support near 2040 and the bulls won. Is the rally off of that critical support zone the start of a move to new all time highs or just a dead cat bounce? Let's examine the evidence as of the close on July 13,2015. |
| Price Dimension My May 27, 2015 article "The Battlefield" pointed to the SPX 200-day SMA and chart support at SPX 2040 as the bulls' main defense line and that a break below both could have tremendous consequences. As it turns out, the bears were only able to manage a marginal break below the 200-day SMA and could only get the SPX down to 2044. The bulls held the critical support zone triggering the current sharp rally. There are two equally valid Elliott wave counts of the decline from SPX 2134.72. The bullish count has a double zigzag pattern from the peak at 2134.72 to the correction bottom at 2044.02. The bearish count is a series of "ones" and "twos" down with expanding flats correcting each of the Wave 1 declines. The first Wave 2 peak is at SPX 2129.87 and if the July 13, 2015 high holds, the second Wave 2 peak is at 2100.67. It's a coin toss as to which one of these patterns is the true wave count. While the wave count gives us no clues as to near-term direction, Fibonacci analysis has revealed a significant clue. A .618 retrace of the decline from SPX 2134.72 to 2044.02 is at 2100.07. The high on July 13, 2015 is 2100.67. In addition there are two other Fibonacci coordinates from sub waves within the May to July decline that are close by. One coordinate is at SPX 2101.75 the second is at SPX 2100.86. Having three Fibonacci coordinates in a tight range is usually a formidable barrier. A significant move above this resistance zone would imply the SPX is on the way to at least 2138. |
|
| Figure 1: SPX daily chart. |
| Graphic provided by: Yahoo! Finance. |
| |
| Momentum Dimension In 2000 the Dow Jones Industrial Average (DJIA) peaked in January, the SPX peaked in February with the NASDAQ (COMP) topping last in March. In 2007 the SPX and DJIA hit their tops in early October with the (COMP) peaking last at the end of October. In 2015 the SPX and DJIA hit their highs in mid-May and again (COMP) is the last to top out on June 23, 2015. I call this "the rule of the majority" and it happens when one of the three main US stock indexes makes a major new high or low unconfirmed by the other two indexes. The truth is with the two non-confirming indexes. This latest non-confirmation is just one more bit of evidence, in a massive list of bearish momentum indicators that strongly suggests the US stock market of 2015 is in the same condition as the major peaks made in 2000 and 2007. An unusual momentum occurrence happened in late June to mid- July. The Russell 2000 (RUT) had been one of the weaker indexes. In declining markets you want to short weak stocks and indexes, they usually lead the way down and have the greatest downside performance. This is the reason I chose the Pro Shares Short Russell 2000 ETF (RWM)as the vehicle for a theoretical trade in my April 30, 2015 article. The (RUT) surprisingly went from being the weakest index to the strongest. This knocked out the theoretical trade with a 6% loss. Normally high quality large-cap stocks are the last to top out in a bull market. If the US stock market is in the early part of a multi-month rally, it's very suspicious if small cap stocks are leading the way. |
| Sentiment Dimension Recently there has been a speculative frenzy in the IPO area. Some issues with horrible fundamentals have had huge moves up on their first day. It's like a miniature version of what happened in 2000. Buying manias on top of stock indexes with weak momentum usually lead to more than just a 4% drop of the SPX. On the flip side the put/call ratio July 9, 2015 was 1.4, the highest reading since near the October 2014 bottom which also had a reading of 1.4. It will take a significant move above the formidable resistance at SPX 2100 to propel this index up to the next major resistance area SPX 2138.03 -- discussed in "The Golden Section" article. It would then require two of the three main US stock indexes making new 2015 highs to set the stage for a multi-month rally. SPX 2040 remains as an important support area. A break below that critical zone could trigger a SPX decline of 100 points in as little as one or two days. So far the bulls have won the defensive battle at 2040. Their next challenge is on the offense at 2100. |
Independent investment advisor, trader and writer. He has written articles for Technical Analysis of Stocks & Commodities, Traders.com Advantage,Futuresmag.com and, Finance Magnates. Author of website Four Dimension Trading.
| Website: | www.fourdimensiontrading.com |
| E-mail address: | markrivest@gmail.com |
Click here for more information about our publications!
PRINT THIS ARTICLE

Request Information From Our Sponsors
- StockCharts.com, Inc.
- Candle Patterns
- Candlestick Charting Explained
- Intermarket Technical Analysis
- John Murphy on Chart Analysis
- John Murphy's Chart Pattern Recognition
- John Murphy's Market Message
- MurphyExplainsMarketAnalysis-Intermarket Analysis
- MurphyExplainsMarketAnalysis-Visual Analysis
- StockCharts.com
- Technical Analysis of the Financial Markets
- The Visual Investor
- VectorVest, Inc.
- Executive Premier Workshop
- One-Day Options Course
- OptionsPro
- Retirement Income Workshop
- Sure-Fire Trading Systems (VectorVest, Inc.)
- Trading as a Business Workshop
- VectorVest 7 EOD
- VectorVest 7 RealTime/IntraDay
- VectorVest AutoTester
- VectorVest Educational Services
- VectorVest OnLine
- VectorVest Options Analyzer
- VectorVest ProGraphics v6.0
- VectorVest ProTrader 7
- VectorVest RealTime Derby Tool
- VectorVest Simulator
- VectorVest Variator
- VectorVest Watchdog