

HOT TOPICS LIST
- MACD
- Fibonacci
- RSI
- Gann
- ADXR
- Stochastics
- Volume
- Triangles
- Futures
- Cycles
- Volatility
- ZIGZAG
- MESA
- Retracement
- Aroon
INDICATORS LIST
LIST OF TOPICS
PRINT THIS ARTICLE
by Mark Rivest
The Shanghai Composite can be a guide to trading US and international stock indexes. Here's how.
Position: N/A
Mark Rivest
Independent investment advisor, trader and writer. He has written articles for Technical Analysis of Stocks & Commodities, Traders.com Advantage,Futuresmag.com and, Finance Magnates. Author of website Four Dimension Trading.
PRINT THIS ARTICLE
SUPPORT & RESISTANCE
China Leads The Way
07/27/15 02:49:22 PMby Mark Rivest
The Shanghai Composite can be a guide to trading US and international stock indexes. Here's how.
Position: N/A
| Comments in the US about the recent sharp decline in Chinese stocks have been along the lines of the following - China's has a state controlled economy so they can control their stock market too. The decline of the Chinese stock market is not relevant to their economy. The Chinese trade most of the stocks in their market, so a decline in China won't affect markets in the rest of the world. Wrong! Wrong! Wrong! No government, no matter how powerful, can stop mass fear in a market. The best they can do is slow down a decline, and even that is debatable. A sharp stock market decline of 30% or more in one to two months is definitely relevant to an economy. Such a decline usually signals coming weakness in the next six to nine months. The recent sharp drop in the Chinese stock market caused at least part of the declines in international markets. If there's another sharp drop in the near future, it would probably trigger large sell offs worldwide. |
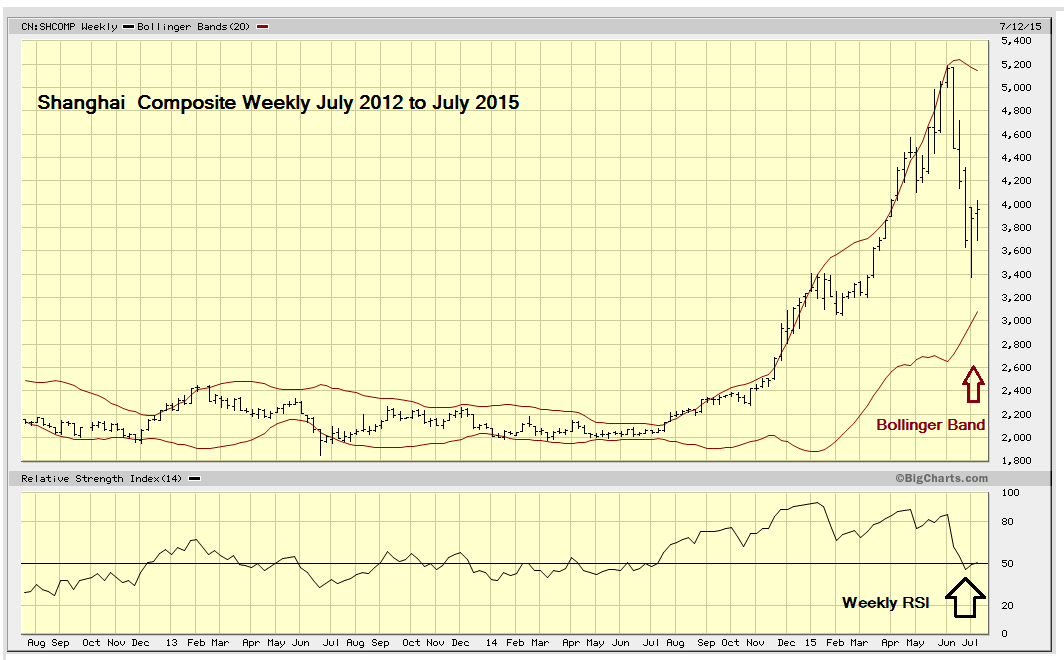
| Momentum Dimension Please see the illustrated chart of the weekly Shanghai Composite in Figure 1. The 34% drop of this index was only able to bring the weekly RSI down to 45.93 - oversold market conditions are registered at 30.00 or lower. Also note that the index failed to reach the lower weekly Bollinger Band. At significant bottoms a stock index should reach at least the lower weekly Bollinger Band and in many cases will break below the lower band. The momentum evidence from these two indicators strongly suggests that the rally off the recent bottom will probably not make new 2015 highs and last weeks not months. |
|
| Figure 1: Shanghai Composite Daily. |
| Graphic provided by: BigCharts.com. |
| |
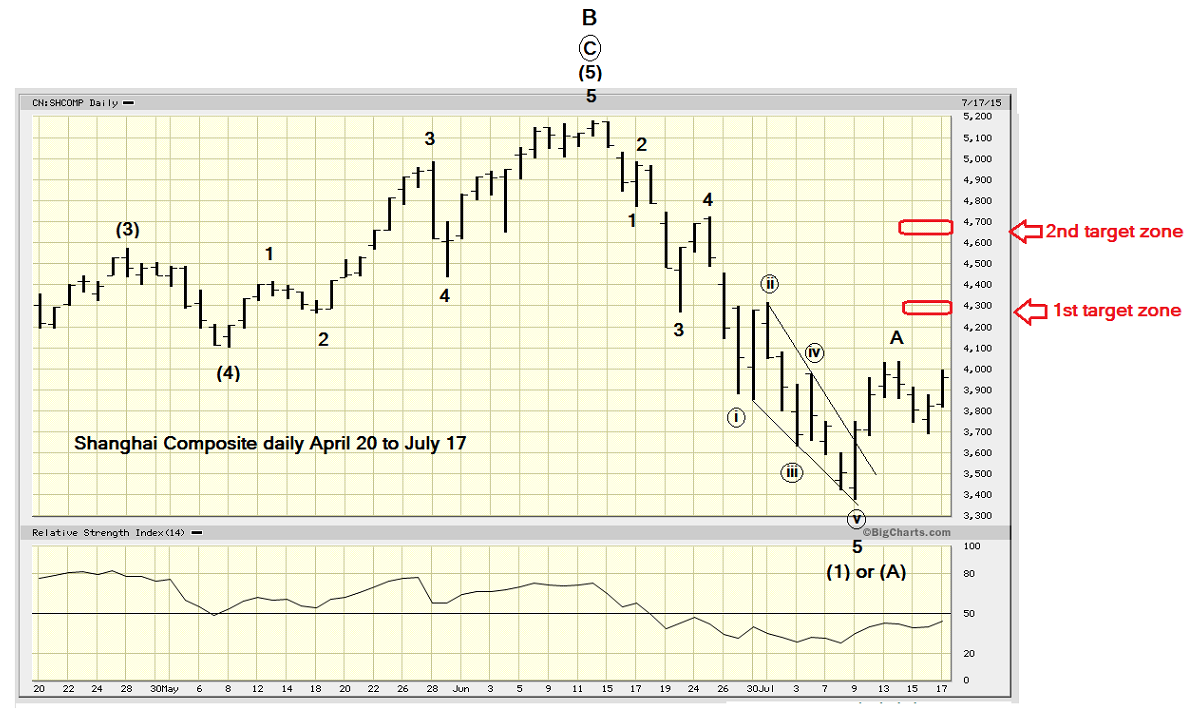
| Price Dimension Please see the illustrated chart of the daily Shanghai Composite in Figure 2. The drop from the 2015 peak at 5178 to the bottom at 3373 has taken the form of a clear five wave impulse pattern. After completion of this pattern, the probabilities imply a counter trend three waves up that should not exceed the peak at 5178. After the three waves up are complete, another five wave pattern down would take the index to at least marginally below 3373. |
|
| Figure 2: Shanghai Composite Weekly. |
| Graphic provided by: BigCharts.com. |
| |
| In any five wave pattern, at least one of the three sub impulse waves is usually extended. The extended wave is the longest of the three sub impulse waves and you can see the subdivisions of the next lower five wave pattern. Normally extended waves in stocks happen in the third wave. For the Shanghai Composite decline June-July the fifth wave is extended. The fascinating part is that this fifth wave is also an ending diagonal triangle. Please see my discussion of ending diagonal triangles (EDT) in my April 3rd article, "Stock Market Turns Down". Usually after an EDT is complete, the subsequent counter trend move returns to the EDT point of origin, which in this case is the 4700 area. However, behavior following fifth wave extensions usually retrace back to the second wave of one lesser degree, which in this case is the 4300 area. The 50% retrace level of the June-July decline is at 4275. This make 4300 zone the primary target for a counter trend rally peak. |
| Time Dimension Please see the terrific July 15 article by Donald W. Pendergast Jr. "China Large Caps Set For a Rebound" in Traders.com Advantage. His cycle analysis for a two to five week countertrend rally of (FXI) iShares China Large Cap ETF should be applicable for the Shanghai Composite. The extremely clear five wave pattern down from the Shanghai peak at 5178 and momentum indicators strongly suggest the current rally should not last more then a few weeks. If the June-July decline is wave one of a larger, still forming impulse wave down, the next decline could be at least equal to the 34% drop of wave one. Another decline of that magnitude could open the selling floodgates worldwide. Every trading day for the next few weeks watch the Shanghai Composite. The very clear Elliott wave pattern makes this index the best tool for catching what could be a world wide stock market peak. Further reading: Frost A.J and Robert Prechter (1985) "Elliott Wave Principle", New Classics Library. Donald W. Pendergast Jr. "China Large Caps Set For a Rebound" 7/15/15 Traders.com Advantage. |
Independent investment advisor, trader and writer. He has written articles for Technical Analysis of Stocks & Commodities, Traders.com Advantage,Futuresmag.com and, Finance Magnates. Author of website Four Dimension Trading.
| Website: | www.fourdimensiontrading.com |
| E-mail address: | markrivest@gmail.com |
Click here for more information about our publications!
PRINT THIS ARTICLE

Request Information From Our Sponsors
- StockCharts.com, Inc.
- Candle Patterns
- Candlestick Charting Explained
- Intermarket Technical Analysis
- John Murphy on Chart Analysis
- John Murphy's Chart Pattern Recognition
- John Murphy's Market Message
- MurphyExplainsMarketAnalysis-Intermarket Analysis
- MurphyExplainsMarketAnalysis-Visual Analysis
- StockCharts.com
- Technical Analysis of the Financial Markets
- The Visual Investor
- VectorVest, Inc.
- Executive Premier Workshop
- One-Day Options Course
- OptionsPro
- Retirement Income Workshop
- Sure-Fire Trading Systems (VectorVest, Inc.)
- Trading as a Business Workshop
- VectorVest 7 EOD
- VectorVest 7 RealTime/IntraDay
- VectorVest AutoTester
- VectorVest Educational Services
- VectorVest OnLine
- VectorVest Options Analyzer
- VectorVest ProGraphics v6.0
- VectorVest ProTrader 7
- VectorVest RealTime Derby Tool
- VectorVest Simulator
- VectorVest Variator
- VectorVest Watchdog