

HOT TOPICS LIST
- MACD
- Fibonacci
- RSI
- Gann
- ADXR
- Stochastics
- Volume
- Triangles
- Futures
- Cycles
- Volatility
- ZIGZAG
- MESA
- Retracement
- Aroon
INDICATORS LIST
LIST OF TOPICS
PRINT THIS ARTICLE
by Mark Rivest
If so, how could this affect the broader stock market?
Position: N/A
Mark Rivest
Independent investment advisor, trader and writer. He has written articles for Technical Analysis of Stocks & Commodities, Traders.com Advantage,Futuresmag.com and, Finance Magnates. Author of website Four Dimension Trading.
PRINT THIS ARTICLE
MARKET TIMING
Dow Utilities Ready For New High?
08/21/15 12:57:27 PMby Mark Rivest
If so, how could this affect the broader stock market?
Position: N/A
| As of the close on August 14, 2015 the S&P 500 (SPX) was still in position for a sudden sharp decline. My August 10, 2015 article "Analyze This" examined the close relationship of the SPX in 2015 vs. 2011. The current market is still following the 2011 path, but at a slightly slower pace. August 19, 2015 had been the projected mini crash bottom. It now appears if there is a mini crash, the bottom could come several days after August 19, 2015. In the mean time while the broader stock indexes have been trending down, the Dow Jones Utility Average (DJUA) has been trending up. Does this mean there won't be a mini crash? An examination of the major peaks made in 2000 and 2007 provide important clues as to what could happen in 2015. The 2000 And 2007 Peaks During 2015 many sentiment and momentum indicators have been giving bearish signals of the same degree as those made at the major stock market tops in 2000 and 2007. Implying that 2015 could also be a major peak and a prelude to a multi-year bear market. A study of the DJUA in relation to the main US stock indexes - Dow Jones Industrial Average (DJIA), NASDAQ (COMP), and the S&P 500 (SPX) during the topping periods 1999-2000 and 2007-2008 provides fascinating clues as to what may happen for the remainder of 2015. In June 1999 the DJUA made an all time-high. Subsequently in January-March 2000 the DJIA, SPX, and COMP made their all-time highs unaccompanied by the DJUA. All four indexes remained below their respective all-time highs for the rest of 2000, until late December when the DJUA all by itself made a new all-time high, after which all four indexes were in a bear market until 2002. In May 2007 the DJUA made an all-time high. Subsequently in October 2007 the SPX and DJIA made all-time highs with COMP making a multi-year high, again unaccompanied by the DJUA. For the remainder of 2007 all four indexes hold below their highs until December when the DJUA all by itself makes a series of new all-time highs going into early January 2008 after which all four indexes were in a bear market until 2009. Interestingly, the DJUA could be repeating this same behavior in 2015. This index made an all-time high in January 2015. The SPX and DJIA make all-time highs in May, and the COMP mad an all-time high in July. Again the highs made by the big three US indexes were un-confirmed by the DJUA. Is the DJUA ready to make a new all-time high? A close examination of the DJUA in 2015 could provide the answer. |
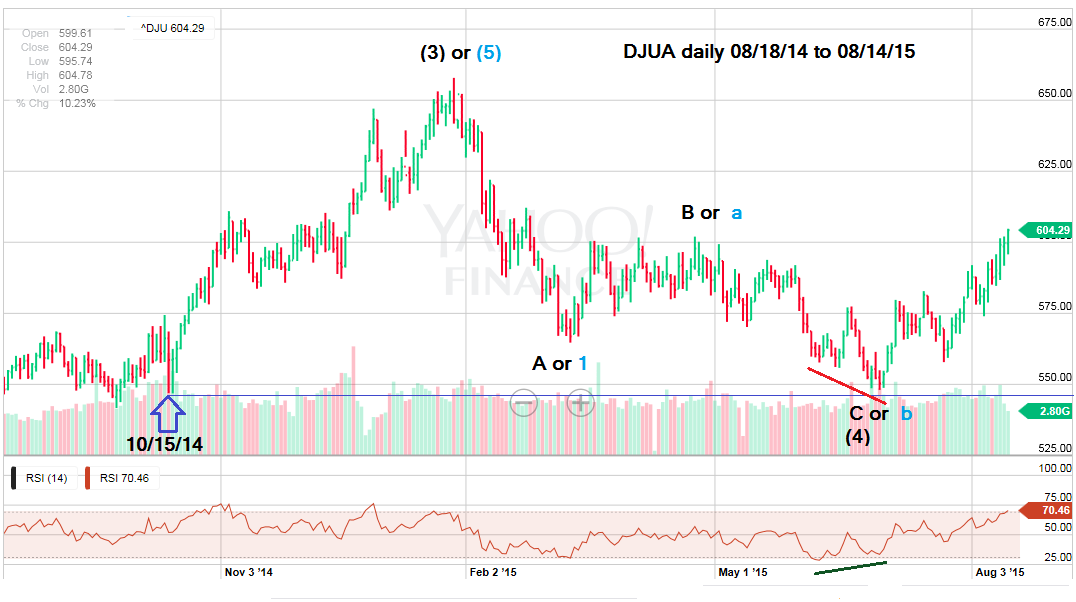
| DJUA in 2015 Please see the illustrated DJUA 2014-2015 daily chart in Figure 1. |
|
| Figure 1. DJUA Daily. Daily chart for the Dow Jones Utility Average index. |
| Graphic provided by: Yahoo! Finance. |
| |
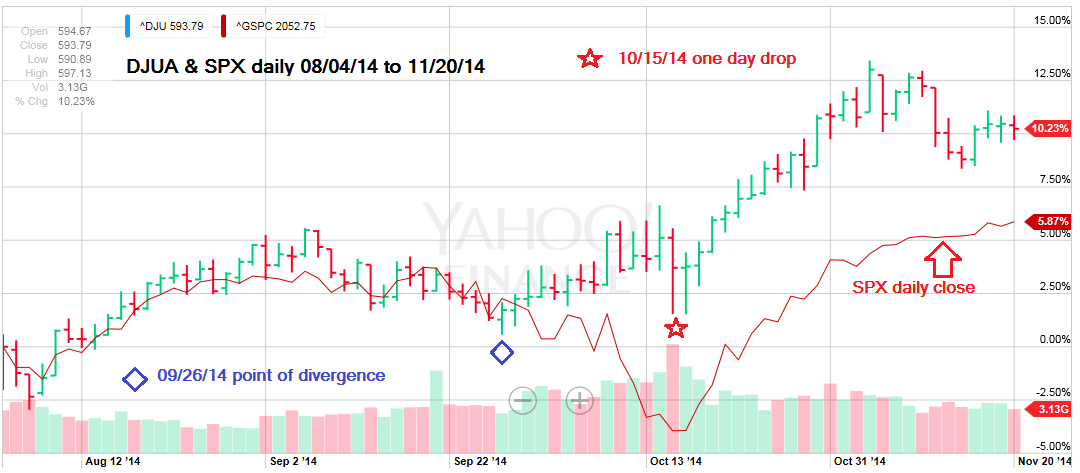
| The DJUA move down can be counted as an Elliott wave zigzag corrective pattern. The supposed wave "C" down is close to 0.618 of wave "A" down. Additionally the June 30, 2015 bottom of 548.09 was close to important chart support made on October 15-16, 2014 at 546.86. Recall this is the same major support area for the SPX September-October 2014 9.8% decline that I mentioned in previous articles. Confirming the June 30, 2015 bottom is a bullish divergence on the daily RSI. The alternate bearish count (in light blue on the chart) is an Elliott wave expanding flat correction. The move on August 14, 2015 brought the supposed wave "C" to just above a 50% retrace of the January-June decline. However, the daily RSI is at a new high for the rally. Stocks and stock indexes almost always require at least one RSI bearish divergence before turning significantly lower. This implies that the DJUA will rally to at least the next Fibonacci retrace level of 0.618 at DJUA 615.94. Can the DJUA rally while the rest of the stock market declines? Yes it can. Please see the illustrated DJUA & SPX 2014 daily chart in Figure 2. |
|
| Figure 2. DJUA vs SPX. September 2014 divergence between the Dow Jones Utility Average and S&P 500. |
| Graphic provided by: Yahoo! Finance. |
| |
| The DJUA managed to go up during most of the September - October 2014 SPX decline. It's only on the last day of the SPX correction on October 15, 2014 that the DJUA has a significant drop holding above the September 26, 2014 bottom. October 15, 2014 was the day when the bulls were selling everything. Strategy As of August 14, 2015, none of the SPX momentum indicators have signaled a significant bottom has been made in the recent decline from the July 20, 2015 top. The DJUA rally since June 30, 2015 could be just one part of a broader stock market advance, but there is no momentum evidence to back up this theory. More likely the SPX and most of the stock market will continue to decline, with SPX 2040 as a major support area, a break of which could trigger a sharp drop down to the 1830-1780 zone. If the DJUA can resist most of any near-term decline of the broader market, then watch the DJUA carefully. If the DJUA suddenly has a sharp drop and holds above its June 30, 2015 bottom, this could be signaling the broader stock market decline is close to a finale. It could also be a great time to buy stocks of utility companies and utility funds. |
Independent investment advisor, trader and writer. He has written articles for Technical Analysis of Stocks & Commodities, Traders.com Advantage,Futuresmag.com and, Finance Magnates. Author of website Four Dimension Trading.
| Website: | www.fourdimensiontrading.com |
| E-mail address: | markrivest@gmail.com |
Click here for more information about our publications!
Comments

Request Information From Our Sponsors
- StockCharts.com, Inc.
- Candle Patterns
- Candlestick Charting Explained
- Intermarket Technical Analysis
- John Murphy on Chart Analysis
- John Murphy's Chart Pattern Recognition
- John Murphy's Market Message
- MurphyExplainsMarketAnalysis-Intermarket Analysis
- MurphyExplainsMarketAnalysis-Visual Analysis
- StockCharts.com
- Technical Analysis of the Financial Markets
- The Visual Investor
- VectorVest, Inc.
- Executive Premier Workshop
- One-Day Options Course
- OptionsPro
- Retirement Income Workshop
- Sure-Fire Trading Systems (VectorVest, Inc.)
- Trading as a Business Workshop
- VectorVest 7 EOD
- VectorVest 7 RealTime/IntraDay
- VectorVest AutoTester
- VectorVest Educational Services
- VectorVest OnLine
- VectorVest Options Analyzer
- VectorVest ProGraphics v6.0
- VectorVest ProTrader 7
- VectorVest RealTime Derby Tool
- VectorVest Simulator
- VectorVest Variator
- VectorVest Watchdog