HOT TOPICS LIST
- MACD
- Fibonacci
- RSI
- Gann
- ADXR
- Stochastics
- Volume
- Triangles
- Futures
- Cycles
- Volatility
- ZIGZAG
- MESA
- Retracement
- Aroon
INDICATORS LIST
LIST OF TOPICS
PRINT THIS ARTICLE
by Mark Rivest
A multi-month rally may have begun for US stocks. Learn how one trendline can keep your trading on the right path.
Position: N/A
Mark Rivest
Independent investment advisor, trader and writer. He has written articles for Technical Analysis of Stocks & Commodities, Traders.com Advantage,Futuresmag.com and, Finance Magnates. Author of website Four Dimension Trading.
PRINT THIS ARTICLE
ELLIOTT WAVE
The Big Picture for US Stocks
02/02/16 04:10:38 PMby Mark Rivest
A multi-month rally may have begun for US stocks. Learn how one trendline can keep your trading on the right path.
Position: N/A
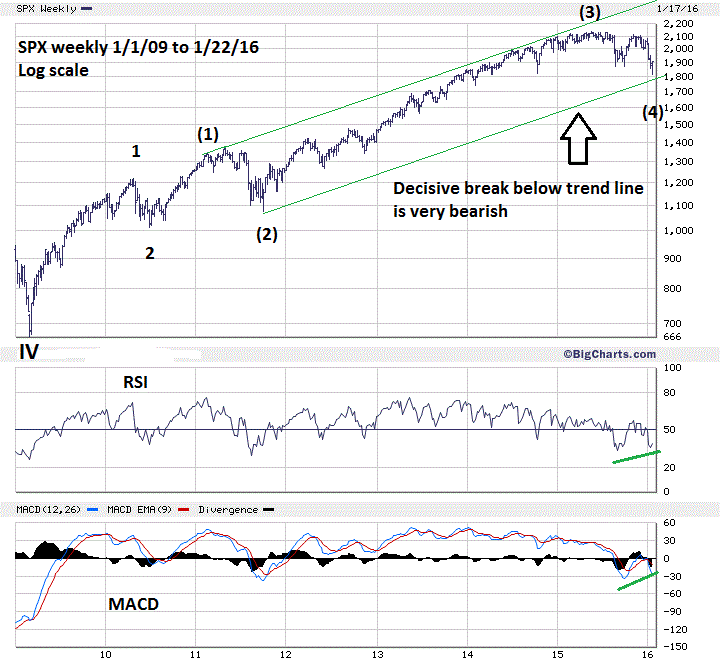
| It looked as if an important bottom could have been made on January 15, 2016 — see my January 22nd article "The Signature of an Important Bottom" — but the stock market decided it needed to go lower. What happened on January 20th is another classic example of when a Fibonacci barrier is broken, the market will then gravitate to the next Fibonacci barrier. There were two significant Fibonacci points at S&P 500 (SPX) 1848 and 1850. When two points are very close to each other it's usually a formidable barrier requiring great force to break through. That's exactly what happened. After 1848 was breached it only took a few trading hours to reach the next Fibonacci zone, the October 2014 bottom at 1820 and the April 2014 at 1814. The bottom on January 20th was a near bulls-eye hit at 1812 — only a little more than 2 points from the April 2014 bottom. There's still one lower Fibonacci point at 1788.29 which is a Fibonacci .236 retrace of the entire SPX bull market from 2009-2015. If the SPX can get to 1788 it would probably be just a few trading days from January 22nd. Regardless if the SPX needs to hit a lower support level, evidence indicates a multi-month rally for stocks could already be underway. Price and Time In my December 8th article "Three Paths To Profits" I noted a .618 relationship to the 2011 SPX decline of 21.5% that targeted 1850 as a potential bottom. The 2015-2016 correction is 70.2% of the 2011 correction — not a Fibonacci ratio. In this case the SPX could be aiming at another target. Please see the weekly SPX chart illustrated in Figure 1. R.N. Elliott discovered that parallel trend channels could aid in helping to count waves. In this case it's a possible five wave pattern from the SPX 1010 bottom made on July, 1 2010. While the SPX has not hit the trendline, it is close enough. If the SPX can very soon reach 1788 there could be a bulls-eye hit of the trendline. If the SPX breaks decisively below the line it could be a major clue that something much more bearish is developing. My December 16th article "The Time Factor" illustrated that the SPX 2011 correction was an Expanding Flat and that the correction using Elliott wave began at the February top, not the May top. Using February as the start makes the correction 228 calendar days, The May 2015-January 2016 decline is 245 calendar days. 228/245 = .93 which is close to equal. However, if we calculate from the May 2011 actual peak its 155 calendar days. 155/245 = .632 very close to a perfect .618. There is a definite time relationship between the supposed wave (2) 2011 decline and the supposed wave (4) 2015-2016 decline. One bearish aspect of the January decline is that January is normally a bullish month. If the decline continues into February it would imply something more bearish is developing. |

|
| Figure 1. SPX Weekly. An Elliott five wave pattern could be forming from the 7/1/10 bottom. |
| Graphic provided by: BigCharts.com. |
| |
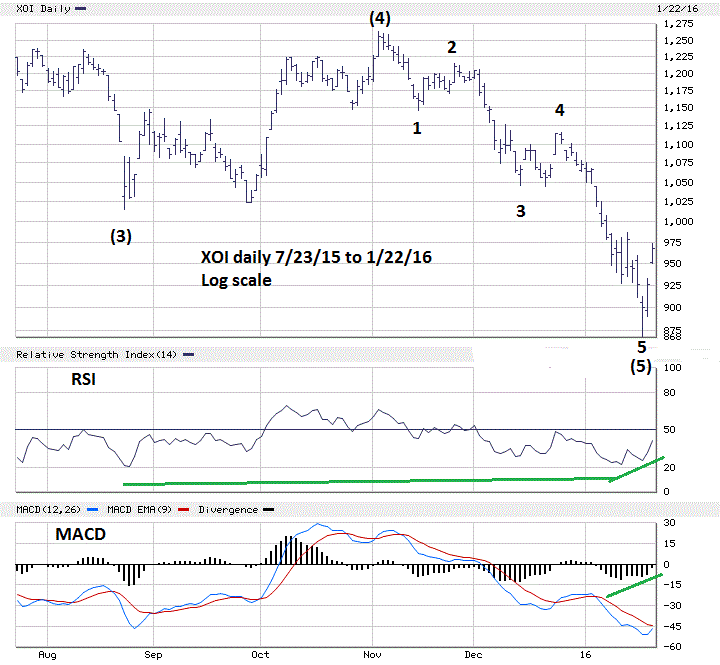
| Momentum and Sentiment The bullish moment discussed in the January 22nd article is still evident. Please see the daily chart of The Oil and Gas Index (XOI) in Figure 2. Daily RSI and MACD are showing near term bullish divergence as well as a bullish divergence vs. the August bottom. The weekly SPX in Figure 1 continues to show RSI and MACD bullish divergences vs. the August bottom. As technical analysts we usually look for quantifiable evidence such as put/call ratios. My January 22nd article noted the total put/call ratio had reached a level indicating a bottom could be in place. The Market Vane Bullish Consensus reading for stocks the week of January 18-22 was 48%, while the reading at the August bottom was 49%. Sometimes the non-financial media will give us evidence that a market turn could be near. Understand this is anecdotal evidence, but when the non-financial media start screaming about any market they are usually late to a trend. Here's the headline I saw on the morning of January 7th by a major non-financial web site. "SOROS: IT'S 2008 ALL OVER AGAIN MARKETS AT 'BEGINNING OF CRISIS' TRILLION$ VANI$H" A few days later a non-financial radio talk show reported that a major investment firm recommended "SELL EVERYTHING!" While it would be really nice for the mass of investors to get a timely heads-up that they could facing a 35-45% drop in the stock market, it just doesn't work that way. If the stock market is currently putting in an intermediate bottom, the next time the stock market falls about 8% the non- financial media will be reluctant to make any comments about the decline. Don't worry they will eventually get around to giving warnings about the stock market, by then a portfolio smashing decline would have probably already happened. |

|
| Figure 2. XOI Daily. Daily RSI and MACD are showing bullish divergences. |
| Graphic provided by: BigCharts.com. |
| |
| Strategy Continue to focus on buying large cap stocks that have been outperforming the broader market averages, such as Altria Group (MO). Also continue using SPX 1760 as a guideline for stop losses. Momentum and sentiment are bullish. The SPX has hit intermediate support and has, as of the close on January 22nd, rallied. The time dimension is the only area that could be considered bearish. There's never a time when any market is 100% bullish or bearish. We focus on the balance of evidence and the balance is saying now is the time to buy. Further reading: Frost A.J and Robert Prechter (1985) "Elliott Wave Principle", New Classics Library. |
Independent investment advisor, trader and writer. He has written articles for Technical Analysis of Stocks & Commodities, Traders.com Advantage,Futuresmag.com and, Finance Magnates. Author of website Four Dimension Trading.
| Website: | www.fourdimensiontrading.com |
| E-mail address: | markrivest@gmail.com |
Click here for more information about our publications!
Comments

|

Request Information From Our Sponsors
- StockCharts.com, Inc.
- Candle Patterns
- Candlestick Charting Explained
- Intermarket Technical Analysis
- John Murphy on Chart Analysis
- John Murphy's Chart Pattern Recognition
- John Murphy's Market Message
- MurphyExplainsMarketAnalysis-Intermarket Analysis
- MurphyExplainsMarketAnalysis-Visual Analysis
- StockCharts.com
- Technical Analysis of the Financial Markets
- The Visual Investor
- VectorVest, Inc.
- Executive Premier Workshop
- One-Day Options Course
- OptionsPro
- Retirement Income Workshop
- Sure-Fire Trading Systems (VectorVest, Inc.)
- Trading as a Business Workshop
- VectorVest 7 EOD
- VectorVest 7 RealTime/IntraDay
- VectorVest AutoTester
- VectorVest Educational Services
- VectorVest OnLine
- VectorVest Options Analyzer
- VectorVest ProGraphics v6.0
- VectorVest ProTrader 7
- VectorVest RealTime Derby Tool
- VectorVest Simulator
- VectorVest Variator
- VectorVest Watchdog
