HOT TOPICS LIST
- MACD
- Fibonacci
- RSI
- Gann
- ADXR
- Stochastics
- Volume
- Triangles
- Futures
- Cycles
- Volatility
- ZIGZAG
- MESA
- Retracement
- Aroon
INDICATORS LIST
LIST OF TOPICS
PRINT THIS ARTICLE
by Mark Rivest
US stock indices are poised for a December decline - Elliott wave theory shows the paths to the next buying opportunity.
Position: N/A
Mark Rivest
Independent investment advisor, trader and writer. He has written articles for Technical Analysis of Stocks & Commodities, Traders.com Advantage,Futuresmag.com and, Finance Magnates. Author of website Four Dimension Trading.
PRINT THIS ARTICLE
ELLIOTT WAVE
Three Paths to Profits
12/08/15 03:38:34 PMby Mark Rivest
US stock indices are poised for a December decline - Elliott wave theory shows the paths to the next buying opportunity.
Position: N/A
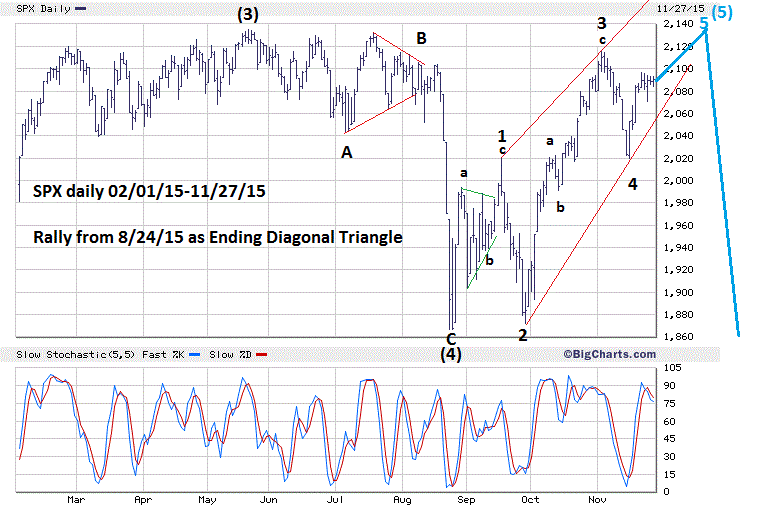
| My last article "Stock Market Building a Base?" illustrated how the S&P 500 (SPX) could be building a base for a multi month rally. The next phase of the base may have already begun with a decline that could bottom near the end of December. Path #1: Ending Diagonal Triangle Under Construction Elliott wave theory always has at least two wave counts as possible paths any market could take. The component waves of a horizontal triangle sub divide into three waves, therefore an ending diagonal triangle (EDT), which also has components that sub divide into three waves, is the best candidate for an alternate count. Please see my April 3rd article "Stock Market Turns Down" for more information about EDT's. Please see the illustrated daily SPX-EDT chart in Figure 1. In this wave count the SPX could rally up to at least the high of the year at 2134. This could come on, or near, the major Fibonacci time cycle of December 7th illustrated in my last article. If this were to occur the subsequent decline could be very rapid, back to the EDT point of origin of 1867. If the EDT pattern does form and can reach at least 2134 this would affect the long term wave count from the 2009 bottom and would imply a major top in place — the initial decline from the EDT peak would only be the first wave down of a much larger bear market. More about this contingency in a later article if necessary. |

|
| Figure 1. In this wave count the SPX could rally up to at least the high of the year at 2134. |
| Graphic provided by: BigCharts.com. |
| |
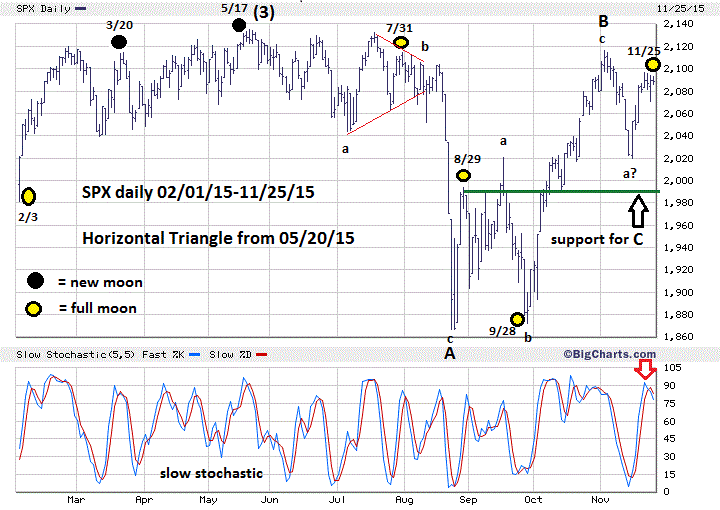
| Path #.2 Horizontal Triangle Under Construction December's bullish seasonal pattern favors this wave count and was illustrated in my last article. Here the August 24th bottom holds with the third wave, "C" down, providing a secondary bottom. The recent decline from 2116 to 2019 is too fast in proportion to the supposed waves "A" up and "B" down, and appears to need more time before its complete. Please see the illustrated daily SPX-horizontal triangle chart in Figure 2. The recent stochastic bearish crossover signal in overbought territory suggests the next decline may have begun. Additionally, November 25th was a full moon. So far, since the beginning of February, there have been six lunar turn signals. The most logical support for the supposed wave "C" bottom could be in the area of 1990 which is a 50% retrace of the rally from 1867 to 2116. There's also prior minor chart support/resistance points in the same zone. If the 1990 area doesn't hold, the next Fibonacci support zone is in the area of 1950-1960. If the SPX goes below that zone it could bottom at any point all the way down to the low of the year at 1867.01, a break below this level would invalidate the horizontal triangle pattern. The December 7th Fibonacci time cycle could help in catching the supposed "C" wave bottom. |

|
| Figure 2. The December 7th Fibonacci time cycle could help in catching the supposed "C" wave bottom. |
| Graphic provided by: BigCharts.com. |
| |
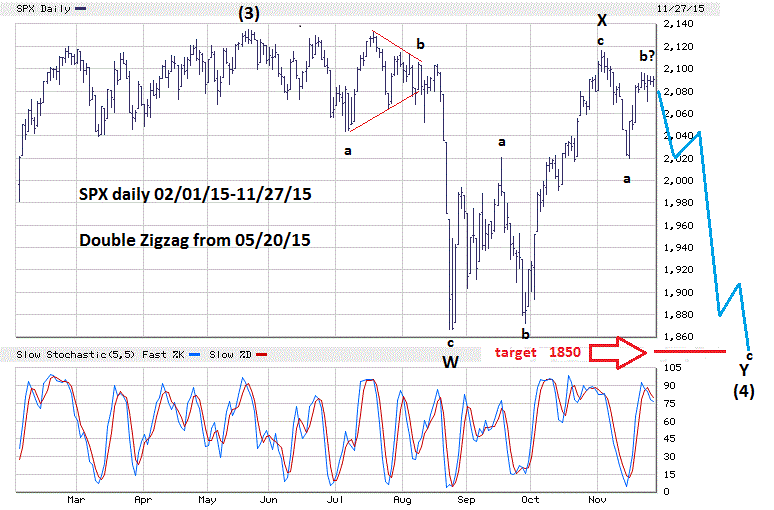
| Path # 3 Double Zigzag Under Construction Please see the illustrated daily SPX-double zigzag chart in Figure 3. My October 28th article noted that the May-August 2015 decline of 12.5% was close to a Fibonacci relationship of .618 of the 21.5% 2011 decline. The bulls-eye target for the relationship is 1850. The August 24th bottom was at 1867, which is what I consider the outer limit of leeway for a .618 relationship. Perhaps the SPX still needs to get down closer to 1850? A major clue this could be the path underway is the decline from May-August was 267.71 points. Subtracting 267.71 from the supposed "X" wave peak of 2116.48 targets 1848.77. Late December could be a time zone for this possible decline to end. |

|
| Figure 3. Late December could be a time zone for this possible decline to end. |
| Graphic provided by: BigCharts.com. |
| |
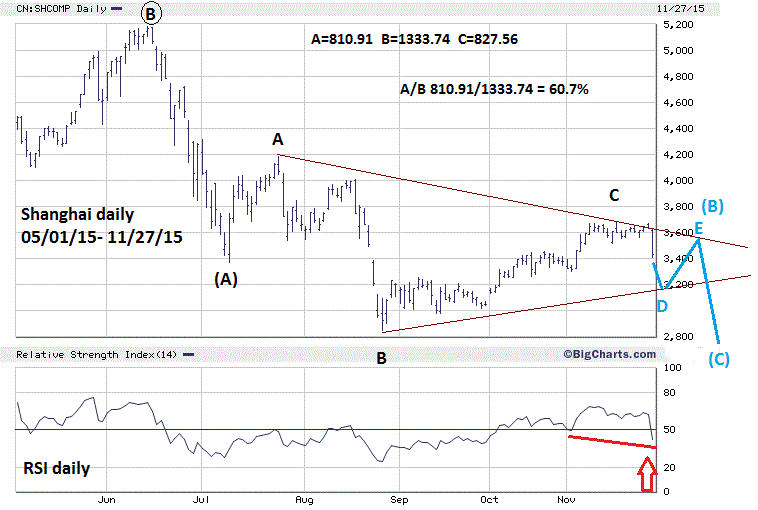
| Shanghai Composite as the catalyst for decline? There are two reasons to follow the Shanghai Composite (SSEC) — it has perhaps the clearest Elliott wave count of any stock index in the world and it has what I call the "Freak out factor". This factor took hold in late August when the SSEC broke below its prior bear market bottom at 3373 and triggered, worldwide, the biggest intraday move of the mini crash. Perhaps the same could happen if the SSEC was to break below its late August bottom at 2850 in December. Please see the illustrated daily SSEC chart in Figure 4. In my October 20th article "China Continues to Lead the Way" I illustrated a standard five wave decline that could have been developing from the late July peak. The SSEC invalidated this pattern by moving above the late July bottom labeled as wave "1". While the near term wave count has changed, the larger pattern from the June peak at 5178 is still incomplete and strongly implies the bottom at 2850 will be taken out. The most likely Elliott wave pattern from the early July 3373 bottom is a horizontal triangle forming. Normally there are Fibonacci relationships between the sub waves. In this case, waves "A" and "C" are near equal, and both are close to a .618 relationship to wave "B". A near term signal that the SSEC will go lower is the daily RSI. Note that the RSI close on November 27th was lower than the level recorded in the early November decline. This implies prices should go below at least this level. The potential SSEC decline could complete in late December. A more precise price forecast for the bottom can be made after the supposed horizontal triangle is complete. |

|
| Figure 4. The potential SSEC decline could complete in late December. |
| Graphic provided by: BigCharts.com. |
| |
| Strategy November-April is normally the bullish season for the US stock market and large cap stocks have had a very strong rally from the late September bottom. On the other side of the coin, SSEC's Elliott wave pattern points to a probable new bear market low. Hedging is a good plan when there are mixed signals. Continue holding large cap stocks. Exit positions in long stock funds, stagger entries into non leveraged inverse stock funds. Use a 5% loss as the exit point for these stock funds. If profitable, hold until late December. The cusp of a new year can sometimes bring a trend change for stock markets. It will be a gift for stock bulls if the SPX can get down to 1850 near the end of 2015. Christmas time for stock traders! Further reading: Frost A.J and Robert Prechter (1985) "Elliott Wave Principle", New Classics Library. |
Independent investment advisor, trader and writer. He has written articles for Technical Analysis of Stocks & Commodities, Traders.com Advantage,Futuresmag.com and, Finance Magnates. Author of website Four Dimension Trading.
| Website: | www.fourdimensiontrading.com |
| E-mail address: | markrivest@gmail.com |
Click here for more information about our publications!
Comments
Date: 12/10/15Rank: 5Comment:

Request Information From Our Sponsors
- StockCharts.com, Inc.
- Candle Patterns
- Candlestick Charting Explained
- Intermarket Technical Analysis
- John Murphy on Chart Analysis
- John Murphy's Chart Pattern Recognition
- John Murphy's Market Message
- MurphyExplainsMarketAnalysis-Intermarket Analysis
- MurphyExplainsMarketAnalysis-Visual Analysis
- StockCharts.com
- Technical Analysis of the Financial Markets
- The Visual Investor
- VectorVest, Inc.
- Executive Premier Workshop
- One-Day Options Course
- OptionsPro
- Retirement Income Workshop
- Sure-Fire Trading Systems (VectorVest, Inc.)
- Trading as a Business Workshop
- VectorVest 7 EOD
- VectorVest 7 RealTime/IntraDay
- VectorVest AutoTester
- VectorVest Educational Services
- VectorVest OnLine
- VectorVest Options Analyzer
- VectorVest ProGraphics v6.0
- VectorVest ProTrader 7
- VectorVest RealTime Derby Tool
- VectorVest Simulator
- VectorVest Variator
- VectorVest Watchdog
