

HOT TOPICS LIST
- MACD
- Fibonacci
- RSI
- Gann
- ADXR
- Stochastics
- Volume
- Triangles
- Futures
- Cycles
- Volatility
- ZIGZAG
- MESA
- Retracement
- Aroon
INDICATORS LIST
LIST OF TOPICS
PRINT THIS ARTICLE
by Mark Rivest
How late 2015 could be setting the stage for multi month rally.
Position: N/A
Mark Rivest
Independent investment advisor, trader and writer. He has written articles for Technical Analysis of Stocks & Commodities, Traders.com Advantage,Futuresmag.com and, Finance Magnates. Author of website Four Dimension Trading.
PRINT THIS ARTICLE
ELLIOTT WAVE
Stock Market Building A Base?
11/30/15 03:48:29 PMby Mark Rivest
How late 2015 could be setting the stage for multi month rally.
Position: N/A
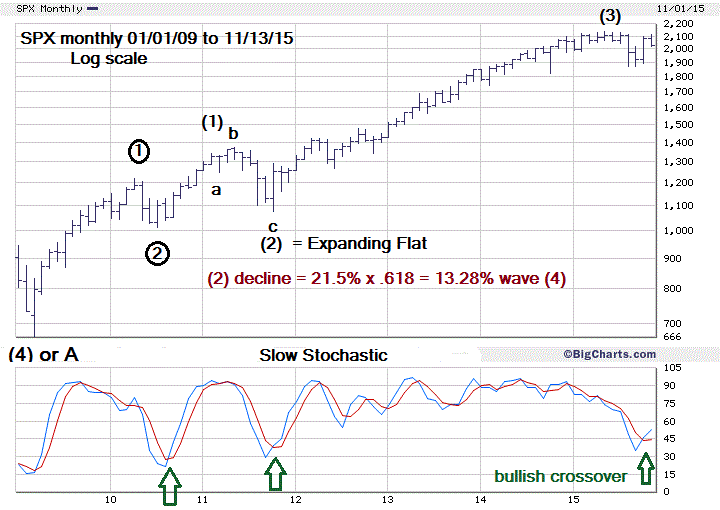
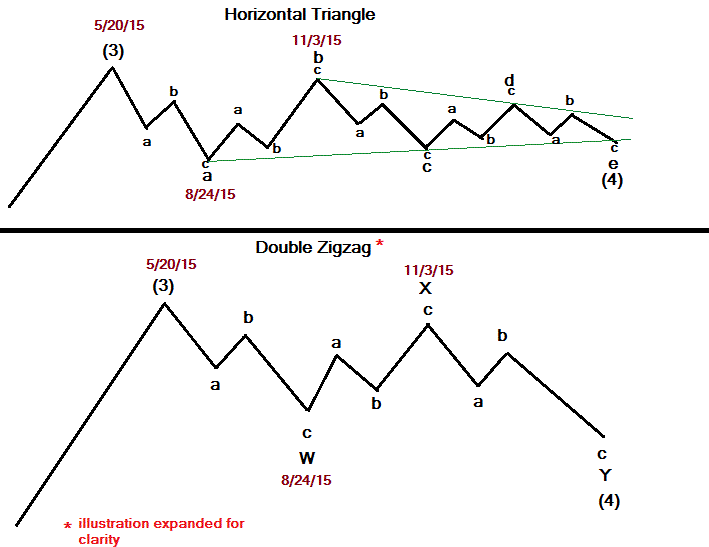
| On November 16th the US stock market opened at a new correction low and then proceeded to rally all day. My November 11th article "Winning In The Bullish Season" forecasted a bulls-eye bottom on November 12th in the area of S&P 500 (SPX ) 1985-2035. The low on the 16th was 2019.74, a .382 retrace of the SPX August to November rally is 2021.19. There's a high probability a rally of at least one trading week has begun, could there be another bottom below SPX 2019.74? Elliott wave theory offers us two pathways the SPX could take in late 2015. Price Dimension Please see the monthly SPX chart in Figure 1. This is an update of the chart illustrated in my October 28th article. One of the clues that the bull market from 2009 is still alive — the SPX August 2015 decline is related to the 2011 decline by the Fibonacci ratio of .618. The bulls-eye level for the 2015 decline is SPX 1850 — the August 24th low was at 1867. The 2011 wave (2) correction was an Expanding Flat. This formation begins with a three wave decline followed by a three wave rally that exceeds the high of the prior impulse wave. The pattern completes with a five wave decline that exceeds the low of the initial decline. Under Elliott waves guidelines for alternation, wave (4) should be a different corrective pattern then wave (2). Please see the illustrated Elliott wave patterns in Figure 2. Because November-April is usually a bullish time for stocks, the Horizontal Triangle is the most likely pattern that could be underway between now and the end of the year. If so, the August bottom should hold. If the SPX decides to take a more bearish trek, then the Double Zigzag pattern would be in effect. If so, a likely end point could be 1850, the bulls-eye relationship to the 2011 correction. Please see the daily SPX chart illustrated in Figure 3. |
|
| Figure 1: S&P 500 Monthly Chart. Elliott wave pattern from 2009. |
| Graphic provided by: BigCharts.com. |
| |
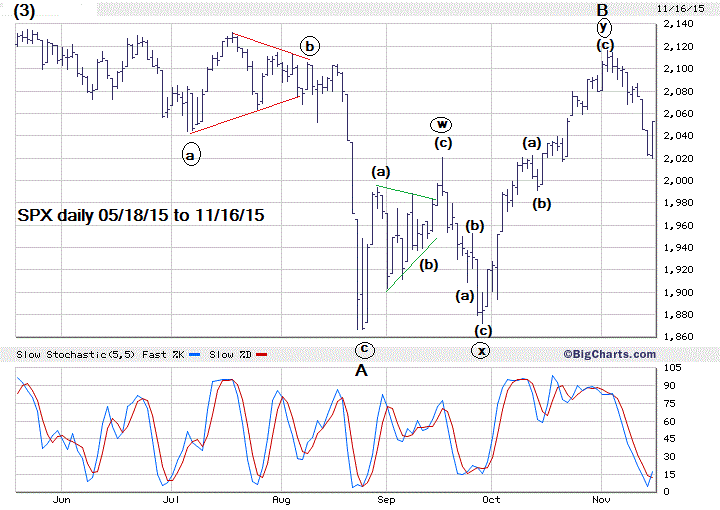
| A reason the SPX could be in a Horizontal Triangle or a Double Zigzag is that the August-November rally was choppy and looks like a corrective pattern. The May-August decline looks corrective. A corrective decline followed by a corrective rally implies a larger corrective pattern is under construction. Additionally the deep retrace of the prior decline is characteristic of either "B" waves in Horizontal Triangles or "X" waves in Double Zigzags. The November 3-16 decline could be a completed wave "C" of the Horizontal Triangle. If not complete. the most likely area for the "C" wave to bottom is in the SPX 1950-1965 zone. Bullish seasonal patterns argue against this happening, but keep this level in mind if SPX 2019.74 is breached in the next few weeks. |
|
| Figure 2: Two Elliott wave corrective patterns |
| Graphic provided by: Mark Rivest. |
| |
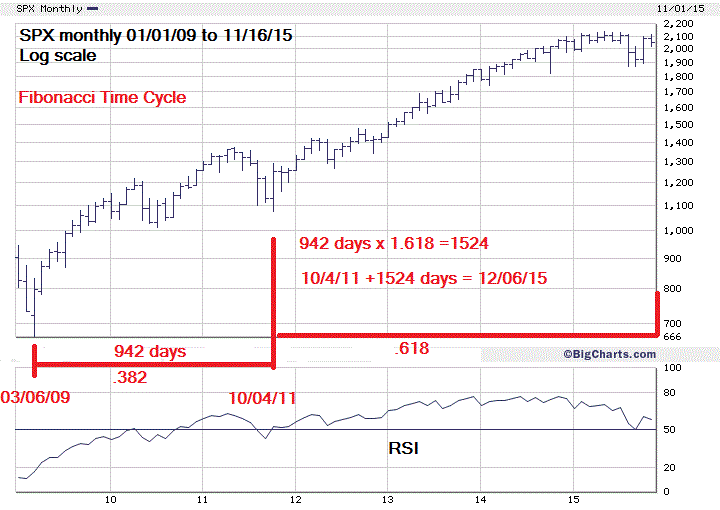
| Time Dimension Please see the monthly SPX chart in Figure 4. Illustrated is a large Fibonacci time cycle targeting Sunday December 6th as a possible turn date. December 7th is the closest trading day. While both coordinates March 6, 2009 and October 4, 2011 were bottoms, the forecasted turn doesn't have to be a bottom. It depends on the direction of a market as it approaches the time cycle. A Fibonacci time cycle over a period of a few months could have a leeway of plus or minus two trading days. A forecast covering a period of several years would normally have a leeway of one to two weeks. In this particular situation we may be able have greater precision. December 4, 1987 and December 9, 1994 were significant bottoms. December 5, 2001 was a short term peak, 2008 had no significant turn. Three out of four turns implies a possible seven year periodic cycle. |
|
| Figure 3: S&P 500 Daily Chart. SPX six-month Elliott wave pattern. |
| Graphic provided by: BigCharts.com. |
| |
| Strategy Bullish seasonality and the main US stock indices' ability to trade in the upper area of a one-year range implies the long term bull market from 2009 is still alive. Near term over the next few weeks there could be some choppy activity. Continue focusing on buying large cap stocks that are outperforming the SPX. Base building can be boring and stagnant prices could tempt you into liquidating positions, but if you have a profitable position resist the temptation to liquidate — it could be difficult to reestablish the position at higher prices. Further reading: Frost A.J and Robert Prechter (1985) "Elliott Wave Principle", New Classics Library. |
|
| Figure 4: S&P 500 Monthly Chart. The long term Fibonacci cycle points to a turn on December 6th, 2015. |
| Graphic provided by: BigCharts.com. |
| |
Independent investment advisor, trader and writer. He has written articles for Technical Analysis of Stocks & Commodities, Traders.com Advantage,Futuresmag.com and, Finance Magnates. Author of website Four Dimension Trading.
| Website: | www.fourdimensiontrading.com |
| E-mail address: | markrivest@gmail.com |
Click here for more information about our publications!
PRINT THIS ARTICLE

Request Information From Our Sponsors
- StockCharts.com, Inc.
- Candle Patterns
- Candlestick Charting Explained
- Intermarket Technical Analysis
- John Murphy on Chart Analysis
- John Murphy's Chart Pattern Recognition
- John Murphy's Market Message
- MurphyExplainsMarketAnalysis-Intermarket Analysis
- MurphyExplainsMarketAnalysis-Visual Analysis
- StockCharts.com
- Technical Analysis of the Financial Markets
- The Visual Investor
- VectorVest, Inc.
- Executive Premier Workshop
- One-Day Options Course
- OptionsPro
- Retirement Income Workshop
- Sure-Fire Trading Systems (VectorVest, Inc.)
- Trading as a Business Workshop
- VectorVest 7 EOD
- VectorVest 7 RealTime/IntraDay
- VectorVest AutoTester
- VectorVest Educational Services
- VectorVest OnLine
- VectorVest Options Analyzer
- VectorVest ProGraphics v6.0
- VectorVest ProTrader 7
- VectorVest RealTime Derby Tool
- VectorVest Simulator
- VectorVest Variator
- VectorVest Watchdog