HOT TOPICS LIST
- MACD
- Fibonacci
- RSI
- Gann
- ADXR
- Stochastics
- Volume
- Triangles
- Futures
- Cycles
- Volatility
- ZIGZAG
- MESA
- Retracement
- Aroon
INDICATORS LIST
LIST OF TOPICS
PRINT THIS ARTICLE
by Mark Rivest
How to find the best stocks to maximize profits.
Position: N/A
Mark Rivest
Independent investment advisor, trader and writer. He has written articles for Technical Analysis of Stocks & Commodities, Traders.com Advantage,Futuresmag.com and, Finance Magnates. Author of website Four Dimension Trading.
PRINT THIS ARTICLE
MOMENTUM
Winning In The Bullish Season
11/11/15 03:39:20 PMby Mark Rivest
How to find the best stocks to maximize profits.
Position: N/A
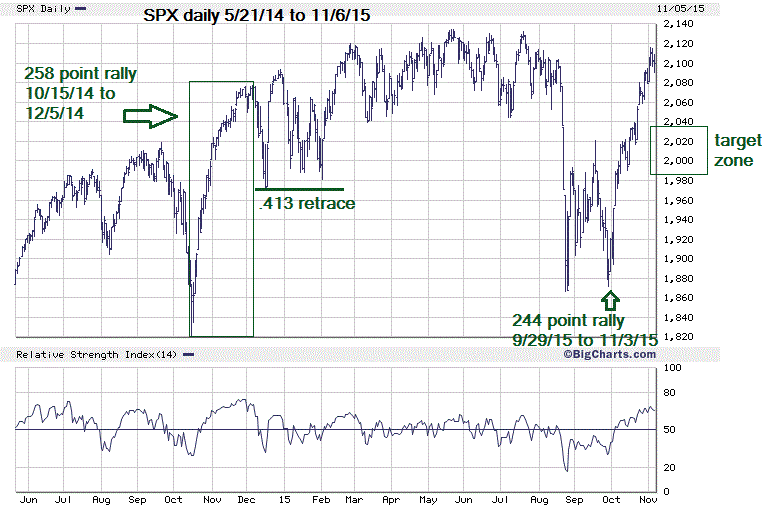
| Since September 29th the stock market and in particular large cap stocks have been in a persistent rally. Is it too late to enter new long stock positions? Absolutely not! Using a baseball analogy the stock market is probably just in the first inning of a bullish move that could last well into 2016. The key to success will be stock selection. What follows are guidelines for finding areas with maximum profit potential. Late 2014 vs. Late 2015 My October 28th article "Is The Stock Bear Market Finished?" illustrated a chart of the S&P 500 (SPX) with a possible near term peak at 2079 on October 23rd. As it turned out, the SPX continued rising into November 3rd hitting 2116. Short term momentum indicators were over bought at the October 23rd peak and were even more over bought on the November 3rd top. This phenomenon is typical in bull markets and is one more piece of evidence that the rally from August 24th is the beginning of a new bull market and not a large bear market rally. Please see the daily SPX chart in Figure 1. The SPX rally from September 29, 2015 looks very similar to the rally off the bottom made on October 15, 2014. If the 2015 rally becomes an exact duplicate of the 2014 rally we can expect the SPX to have an intermediate peak at 2129 on November 19, 2015. If November 3rd turns out to be an intermediate peak the subsequent decline could be about the same size as the SPX decline in December 2014, which lasted seven trading days and retraced 41.3% of the prior rally. Illustrated is a price target zone 1985-2035, or 33%-53%, of the prior rally. Bulls-eye target day is November 12th. If near term the November 3rd SPX peak is exceeded, use 33%-53% retrace and seven trading days as a guide to measure a correction off the next top. |

|
| Figure 1. SPX Daily. Late 2014 and late 2015 have similar rallies. |
| Graphic provided by: BigCharts.com. |
| |
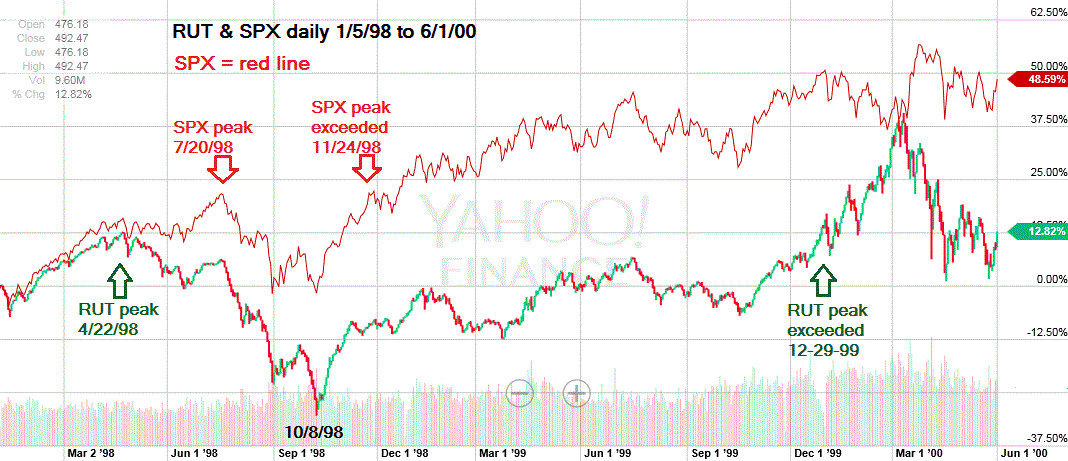
| Underperforming Stocks Since its June 2015 peak the Russell 2000 (RUT) small cap index has underperformed the SPX. In August, the SPX bottomed on the 24th while RUT bottomed on the 26th. On September 29th the SPX held above its August low, but the RUT made a new 2015 low. As of November 3rd the SPX had retraced 93.1% of its 2015 decline. As of November 6th RUT has retraced only 55.8% of its 2015 decline. There's a precedent for this underperformance of small cap stocks. Please see the daily chart of RUT & SPX 1998-2000 in Figure 2. While the SPX was able to retrace all of its 1998 decline in about two months, the RUT took more then a year to reclaim its prior peak. Also note that after the RUT made a new high in late 1999 it briefly began to outperform the SPX. This is typical of a very late stage bull market. After most of the high quality stocks have made extended moves up, the crowd is lured into supposed "cheap" stocks. Also note that after a quick two month rally in 2000 these "cheap" stocks began to outperform on the downside. Avoid any small cap funds, they will probably continue to underperform the large cap funds. Purchases of small cap stocks should be restricted to issues that are outperforming the SPX. As for mid cap stocks, the S&P 400 mid cap index (MDY) has retraced 78.3% of its 2015 decline. In 1998, MDY reclaimed its prior high only a month after the SPX new high. In 2000, MDY didn't peak until June, three months after SPX. Keep exposure to mid cap funds to a minimum. Better opportunities will probably be found in mid cap stocks that are outperforming the SPX. |

|
| Figure 2. SPX Daily vs. RUT Daily. RUT took more then a year to reclaim its prior peak. |
| Graphic provided by: Yahoo! Finance. |
| |
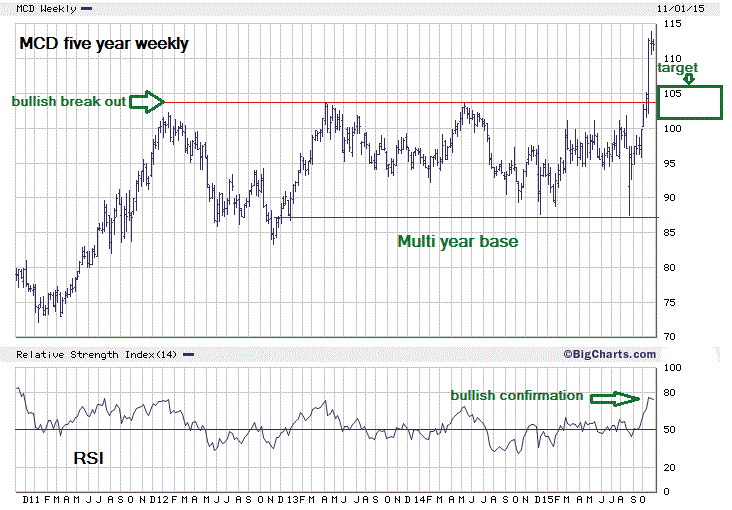
| Outperforming Stocks The theme since the August 24th mini panic bottom has been, "bigger is better", with the large cap stocks leading the way. An excellent candidate for future purchase is McDonald's Corp (MCD). Please see the MCD five-year weekly chart in Figure 3. MCD is outperforming the SPX, has broken out of a multi year base, and its weekly RSI is higher than at any point since 2011. All of these factors strongly imply that MCD is in the early phase of a multi month rally. A 38.2% retrace of the rally from August 24th to the recent high at 113.96 on October 26th targets 103.86, which is very close to the April 2013 peak of 103.70 and the May 2014 peak of 103.78. This tight cluster is the bulls-eye target, with 102-106 as the broader target zone. My October 20th article noted that the Consumer Discretionary ETF (XLY) as the strongest of the ten main stock sectors. Since then this ETF has moved to a new 2015 high and is still the strongest sector. Just behind is the Technology Sector ETF (XLK), which has also recently made a new 2015 high. Both of these funds are excellent candidates for purchase, assuming they have near term pull backs. Use the previously discussed SPX price target zone as a guide for buying these funds. |

|
| Figure 3. Weekly Chart for McDonalds. MCD bulls-eye target 103.70-103.86. |
| Graphic provided by: BigCharts.com. |
| |
| If the stock market is in the early phase of a multi month rally, it's the late stage of a much larger bull market that began in 2009. As stock bull markets age, fewer and fewer stocks participate. What we've seen since the August 24th bottom fits that scenario perfectly. In late 2015-2016 what you buy could be just as important as when you buy. |
Independent investment advisor, trader and writer. He has written articles for Technical Analysis of Stocks & Commodities, Traders.com Advantage,Futuresmag.com and, Finance Magnates. Author of website Four Dimension Trading.
| Website: | www.fourdimensiontrading.com |
| E-mail address: | markrivest@gmail.com |
Click here for more information about our publications!
PRINT THIS ARTICLE

Request Information From Our Sponsors
- StockCharts.com, Inc.
- Candle Patterns
- Candlestick Charting Explained
- Intermarket Technical Analysis
- John Murphy on Chart Analysis
- John Murphy's Chart Pattern Recognition
- John Murphy's Market Message
- MurphyExplainsMarketAnalysis-Intermarket Analysis
- MurphyExplainsMarketAnalysis-Visual Analysis
- StockCharts.com
- Technical Analysis of the Financial Markets
- The Visual Investor
- VectorVest, Inc.
- Executive Premier Workshop
- One-Day Options Course
- OptionsPro
- Retirement Income Workshop
- Sure-Fire Trading Systems (VectorVest, Inc.)
- Trading as a Business Workshop
- VectorVest 7 EOD
- VectorVest 7 RealTime/IntraDay
- VectorVest AutoTester
- VectorVest Educational Services
- VectorVest OnLine
- VectorVest Options Analyzer
- VectorVest ProGraphics v6.0
- VectorVest ProTrader 7
- VectorVest RealTime Derby Tool
- VectorVest Simulator
- VectorVest Variator
- VectorVest Watchdog
