HOT TOPICS LIST
- MACD
- Fibonacci
- RSI
- Gann
- ADXR
- Stochastics
- Volume
- Triangles
- Futures
- Cycles
- Volatility
- ZIGZAG
- MESA
- Retracement
- Aroon
INDICATORS LIST
LIST OF TOPICS
PRINT THIS ARTICLE
by Mark Rivest
The balance of evidence is now bullish for stocks. Here's what happened and how to take advantage of a probable trend change.
Position: N/A
Mark Rivest
Independent investment advisor, trader and writer. He has written articles for Technical Analysis of Stocks & Commodities, Traders.com Advantage,Futuresmag.com and, Finance Magnates. Author of website Four Dimension Trading.
PRINT THIS ARTICLE
ELLIOTT WAVE
Is The Stock Bear Market Finished?
10/28/15 03:02:54 PMby Mark Rivest
The balance of evidence is now bullish for stocks. Here's what happened and how to take advantage of a probable trend change.
Position: N/A
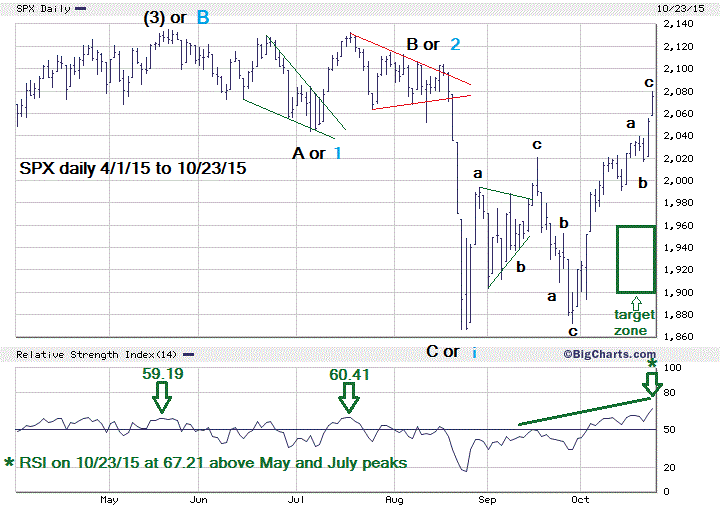
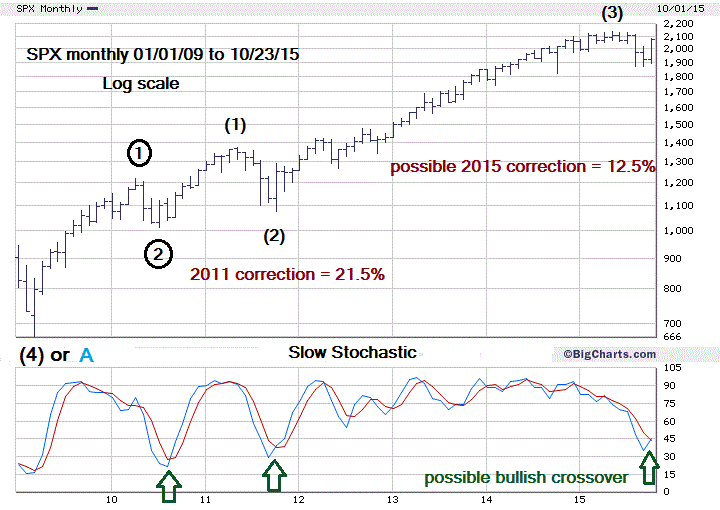
| On October 22, 2015 the S&P 500 (SPX) moved decisively above very important resistance at 2040. This is the strongest piece of evidence that stocks could be in the early phase a multi-month rally. Besides this powerful breakout there are many other indicators that strongly imply the panic bottom of August 24th will probably hold. What follows is a detailed review of evidence within the market. Momentum Dimension As far back as May 27th in my article "The Battlefield" I noted the importance of 2040 as a must hold area for the bulls. In several subsequent articles I stated that a break below 2040 could trigger a panic, which is exactly what happened. The reason 2040 would then become important resistance is two fold. First is overhead resistance — anyone that bought stocks above 2040 and was still long would have a great incentive to sell. Second, fast and big moves down like what happened after 2040 was breached is the signature of fund managers selling. Their portfolios are huge, and it's doubtful they could have sold all the stocks they wanted in just a few days. Moving above 2040 implies fund managers are not doing any heavy selling. Maybe they know something that we don't know. In my October 20th article "China Continues To Lead The Way" I noted that SPX advance/decline line, volume and daily RSI were significantly more bullish in the September-October rally then the readings during the August-September rally. These readings continued to be bullish, in particular the daily RSI. Please see the daily SPX chart in Figure 1. On October 23rd, the daily RSI hit 67.21 — significantly higher then the readings of May and July peaks. This momentum strength implies that within a few months SPX could move above the double top made in the low 2130 area. Please see the monthly SPX chart in Figure 2. There is a possible bullish crossover on the slow stochastic that implies the start of a multi month rally. On the bearish side the Nasdaq advance/decline line in October is still below its September level. Also the Russell 2000 Small Cap Index is significantly lagging behind the progress of the three main US stock indices. Note this same phenomenon happened in early 1999, which ended being a very bullish year. |

|
| Figure 1. SPX Daily. A possible bottom at 1900-1960 could come in the November 2-13 time zone. |
| Graphic provided by: BigCharts.com. |
| |
| Time Dimension My October 20th article noted that during the last twenty years, 80% of the time the SPX has closed up in November. If the SPX were to begin a decline on October 26th it will probably last no longer than mid November, after which the bullish seasonality should begin. The broader bullish seasonality normally lasts until at least March. |

|
| Figure 2. SPX Monthly. This crossover could signal a multi-month rally. |
| Graphic provided by: BigCharts.com. |
| |
| Price Dimension Again please see the daily SPX chart in Figure 1. From May 20-October 23 the SPX has several alternate wave counts. Illustrated on the daily chart are two of the alternatives. The October 20th article noted the post August 24th rally as a wave "Four". Normally fourth waves are shallow, usually retracing 23% or 38% of third waves. Sometimes fourth waves can retrace 62% of a third wave. Anything greater then 62% retrace is suspicious and probably means something else is happening. On October 23rd the supposed fourth wave up had retraced 89% and crossed over into the area of the supposed wave "One". This overlap into wave "One" territory breaks an Elliott rule for standard impulse waves and eliminates that count. There is however a special impulse wave called a "Leading Diagonal Triangle" in which wave "Four" does overlap wave "One". If this count is developing, the subsequent fifth wave down would probably only have a marginal breach of the August 24th bottom. Could the SPX September 17-29 decline be a truncated fifth wave down? Probably not — the daily chart shows this structure sub dividing into three waves not the required five waves. Also most truncated fifth waves retrace at least 90% of the fourth wave. The September 17-29 decline in the Nasdaq and Dow Jones Industrial Average retraced 70% and 63% of their fourth waves. Another alternate count is illustrated in light blue on the daily chart as a possible series of "One's" and "Two's" down from the May peak with the rally into October 23rd as the second wave "Two" up. Increasing bullish momentum going into a seasonally bullish time makes this count a low probability. The most likely wave count from the May top is that a "Horizontal Triangle" is forming. This structure is similar to an "Indecision Triangle". If so, the rally into October 23rd would be wave "B" up followed by wave "C" down that would bottom above the August 24th low at 1867. The typical wave "C" usually retraces 62% of the prior wave "B" or 62% of the length of wave "A". If wave "B" peaked at 2079.74, a .618 retrace targets 1948.28. Using .618 of wave "A" length targets 1914.43. The broad target zone for the next bottom is 1900-1960. Chart support at 1820 and 1789, which is .236 retrace of the bull market from 2009, have been considered the best targets for a significant bottom. Developing bullish evidence now makes this target zone less likely. There is another Fibonacci relationship that gives a clue to what could happen in the next several months. Please see the monthly SPX chart in Figure 2. The 2011 correction was a 21.5% decline. So far the 2015 correction has declined 12.5%. 12.5/21.5 = .581, which is at the outer limit of the leeway I give for a .618 relationship. Within standard impulse waves .618 is a typical relationship of wave "4" to wave "2". This relationship strongly implies that, at least from the 2010 bottom, a standard impulse wave is under construction and when complete the SPX should move above the May peak of 2134. |

|
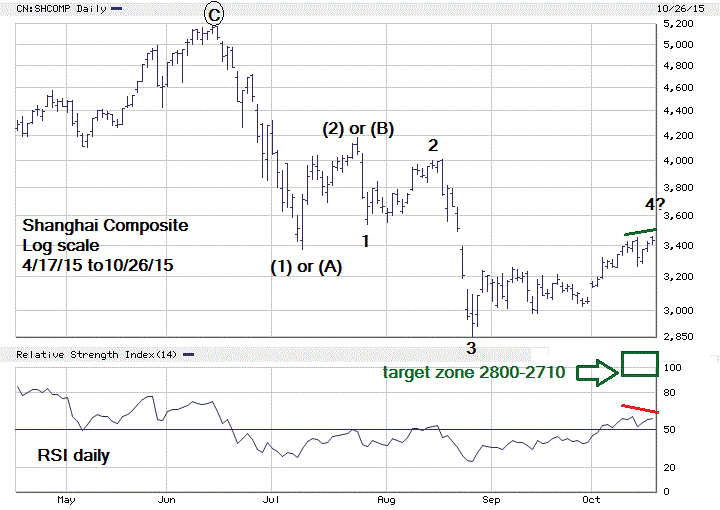
| Figure 3. The Shanghai Composite Index is the best indicator to catch the next US stock market bottom. |
| Graphic provided by: BigCharts.com. |
| |
| Shanghai Composite and Strategy Please see the daily Shanghai Composite chart in Figure 3. This index is still the best indicator to help catch the next bottom for US stock indices. Because the supposed wave "4" has gone higher, a change has been made for the projected bottom. The main Fibonacci coordinate remains 2726.13 but the confirming coordinate has changed to 2779.85, calculated by subtracting .618 of the percentage decline of waves 1-3 from the supposed wave "4" peak at 3457.52. A break below 2850.71 could be the signal for catching a bottom in the US stock indices similar to what happened on August 24th when the Shanghai made a new 2015 low. The expected time zone for a possible bottom is November 2-13. |
| Further reading: Frost A.J and Robert Prechter (1985) "Elliott Wave Principle", New Classics Library. |
Independent investment advisor, trader and writer. He has written articles for Technical Analysis of Stocks & Commodities, Traders.com Advantage,Futuresmag.com and, Finance Magnates. Author of website Four Dimension Trading.
| Website: | www.fourdimensiontrading.com |
| E-mail address: | markrivest@gmail.com |
Click here for more information about our publications!
Comments
Date: 10/29/15Rank: 5Comment: I always enjoy these articles, they are very informative. I enjoy Elliott Wave. Took Bob Prector s newsletter many years ago. I was never that good at identifying the waves.

Request Information From Our Sponsors
- StockCharts.com, Inc.
- Candle Patterns
- Candlestick Charting Explained
- Intermarket Technical Analysis
- John Murphy on Chart Analysis
- John Murphy's Chart Pattern Recognition
- John Murphy's Market Message
- MurphyExplainsMarketAnalysis-Intermarket Analysis
- MurphyExplainsMarketAnalysis-Visual Analysis
- StockCharts.com
- Technical Analysis of the Financial Markets
- The Visual Investor
- VectorVest, Inc.
- Executive Premier Workshop
- One-Day Options Course
- OptionsPro
- Retirement Income Workshop
- Sure-Fire Trading Systems (VectorVest, Inc.)
- Trading as a Business Workshop
- VectorVest 7 EOD
- VectorVest 7 RealTime/IntraDay
- VectorVest AutoTester
- VectorVest Educational Services
- VectorVest OnLine
- VectorVest Options Analyzer
- VectorVest ProGraphics v6.0
- VectorVest ProTrader 7
- VectorVest RealTime Derby Tool
- VectorVest Simulator
- VectorVest Variator
- VectorVest Watchdog
