HOT TOPICS LIST
- MACD
- Fibonacci
- RSI
- Gann
- ADXR
- Stochastics
- Volume
- Triangles
- Futures
- Cycles
- Volatility
- ZIGZAG
- MESA
- Retracement
- Aroon
INDICATORS LIST
LIST OF TOPICS
PRINT THIS ARTICLE
by Mark Rivest
How the Shanghai Composite could signal a global stock market bottom.
Position: N/A
Mark Rivest
Independent investment advisor, trader and writer. He has written articles for Technical Analysis of Stocks & Commodities, Traders.com Advantage,Futuresmag.com and, Finance Magnates. Author of website Four Dimension Trading.
PRINT THIS ARTICLE
ELLIOTT WAVE
China Continues To Lead The Way
10/20/15 01:51:34 PMby Mark Rivest
How the Shanghai Composite could signal a global stock market bottom.
Position: N/A
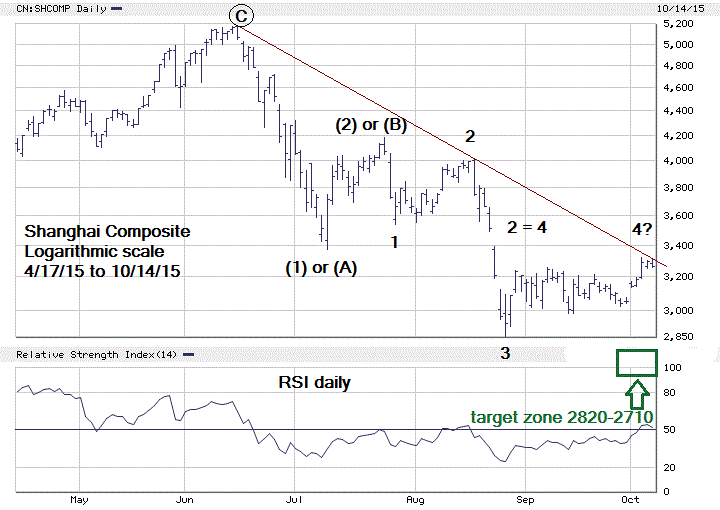
| Sometimes you have to go off the beaten path to find an Elliott wave pattern that could be the key to determine a markets direction. In my October 7th article "October Bottom For The Stock Market?" the focus was on Proctor & Gamble's crystal clear Elliott wave pattern. Today's focus is on the Shanghai Composite (SSEC). Shanghai Composite Take a look at the daily chart of the SSEC in Figure 1. In my July 27th article "China Leads The Way" the focus was on the very clear June to July five wave Elliot decline. The rally off of the July bottom was a clear three wave corrective Zigzag pattern. The subsequent decline from the July peak at 4184.45 is forming what appears to be a developing textbook Elliott five wave pattern. Within any five wave pattern, the corrective waves "Two" and "Four" are usually equal in price. The July to August wave "2" is 468.98 points. The supposed August to October 12th wave "4" rally is 468.00 points, a near perfect hit. Additionally this 468 point rally has retraced .404 of the wave "3" decline from 4006.34 to 2850.71. This is very close to .382 which is the usual Fibonacci retrace of wave "Three" progress. Because the SSEC 2015 decline has been so large, the best way to determine where the next possible bottom could be is to examine the percentage of the declines among the various waves. Usually two of the three sub impulse waves within a larger five wave impulse wave tend to be equal. The wave (1) June to July decline was 34.8% . The wave (2) peak is 4184.45 multiplied by 34.8% equals 1458.32. 4184.45- 1458.32 targets 2726.13. Narrowing the focus to the July to August decline, the supposed wave "1" decline is 15.4%. The supposed wave "4" peak is 3318.71 multiplied by 15.4% equals 511.08. 3318.71- 511.08 targets 2807.63. The broader price zone for a possible wave "5" of (3) is 2820 to 2710. |

|
| Figure 1. Shanghai Composite has a textbook Elliott wave pattern. |
| Graphic provided by: BigCharts.com. |
| |
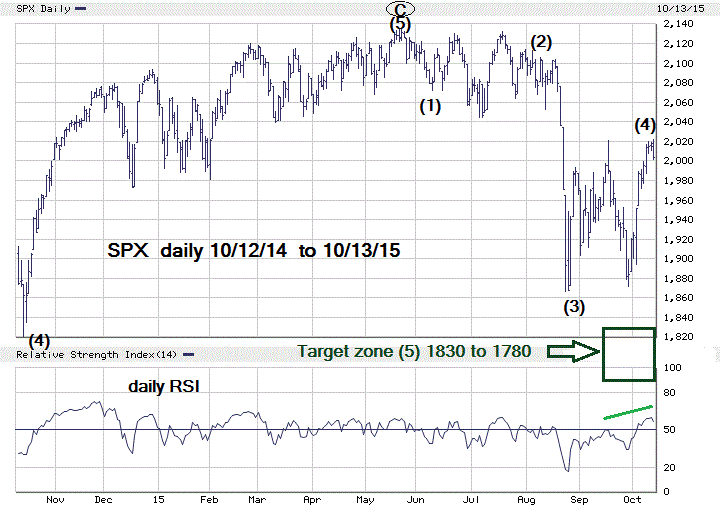
| S&P 500 Please see the daily S&P 500 (SPX) illustrated in Figure 2. My October 7th article listed the September 17th SPX peak as wave (4) of a possible five wave pattern down from the May peak. The decline after September 17th failed to make a new 2015 low and the SPX subsequently rallied above the September peak. The entire move up from August 24th to October 13th still looks very much like a correction within the downside move of the 2015 decline. Additionally the October 13th peak at 2022.34 is in the zone of strong resistance. The big difference between the August-September rally and the September-October rally is momentum. The SPX advance/decline line, volume and the daily RSI were significantly more bullish on the second rally vs. the first rally. The bullish momentum could be setting the stage for future bullish divergences if the SPX can make a new 2015 low, or it could be a hint that the 2015 low of the year is already in place. |

|
| Figure 2. If the SPX is in the target zone of 1830-1780 anytime in October, a bottom could be at hand. |
| Graphic provided by: BigCharts.com. |
| |
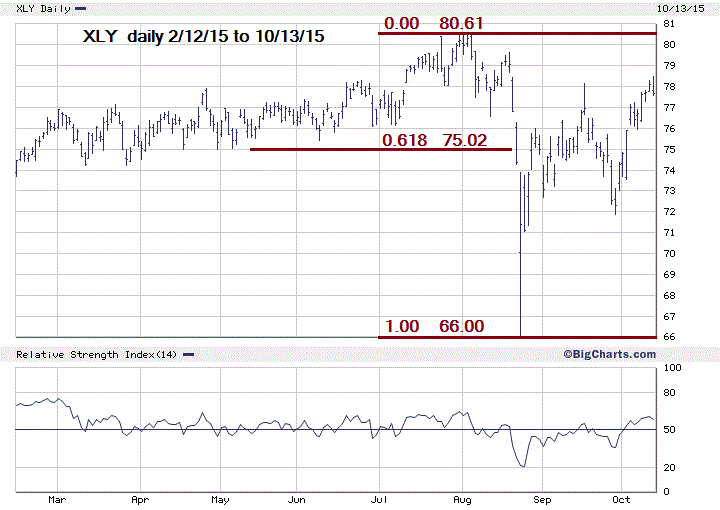
| Strategy Regardless if the SPX can make a new 2015 low or not, as of October 13 SPX has hit a strong resistance zone and short term momentum indicators are overbought. There is a high probability the main US stock indices could be declining into the balance of October. If a significant bottom is made in October you want to focus on buying stocks and ETF's that have declined the least in the prior market decline-they will likely be the leaders in the next market rally. Please see the daily chart of XLY in Figure 3. The Consumer Discretionary Sector ETF (XLY) is the strongest of the ten main stock sectors. As of October 13th its year to date return is 5.13%. XLY has pushed above strong chart and Fibonacci resistance at 75.00 and has retraced more then 85% of its 2015 decline. Even if the main US stock indices are unable to move above their respective 2015 highs, there is a very good chance that XLY can move above its August 2015 top. XLY or any of the component stocks within this ETF could be excellent candidates to participate in the next significant stock market rally. Time is the most important factor for the balance of October which has a long history of producing significant bottoms. During the last twenty years, 80% of the time the SPX has closed up in November. Be on high alert if at any time in October the SPX is trading anywhere in the 1830-1780 target zone a significant bottom could be at hand. My October 7th report noted October 16-19 as a possible time cycle turn. As of October 13th it could be a stretch for the SPX to make a new 2015 low in this time zone. There is a chance that October 16-19 could be a secondary low holding above the August 24th bottom. The SSEC could be the best indicator to spot a bottom in the main US stock indices. On August 24 before the open of US stocks, the SSEC broke below the then 2015 bear market bottom of 3373.54. This was the catalyst for the US mini stock crash which bottomed shortly after the open. The same phenomenon could happen again if at anytime during October the SSEC were to break below the August 28th bear market bottom at 2850.71. Since May of 2015 the bears have been in charge, now momentum and time dimensions point to a possible October bottom. Watch the SSEC it could be the key to catch that bottom. |

|
| Figure 3. XLY has pushed above chart and Fibonacci resistance at 75.00. |
| Graphic provided by: BigCharts.com. |
| |
| Addendum October 16, 2015 — The SPX has rallied into the Fibonacci time zone of October 16-19. Fibonacci resistance .618 retrace of the SPX May-August decline is at 2032.45. Very high probability an important high is being hit today. A subsequent decline could retrace at least 60% of the August-October rally before the end of October. Further reading: Frost A.J and Robert Prechter (1985) "Elliott Wave Principle", New Classics Library. |
Independent investment advisor, trader and writer. He has written articles for Technical Analysis of Stocks & Commodities, Traders.com Advantage,Futuresmag.com and, Finance Magnates. Author of website Four Dimension Trading.
| Website: | www.fourdimensiontrading.com |
| E-mail address: | markrivest@gmail.com |
Click here for more information about our publications!
Comments

Request Information From Our Sponsors
- StockCharts.com, Inc.
- Candle Patterns
- Candlestick Charting Explained
- Intermarket Technical Analysis
- John Murphy on Chart Analysis
- John Murphy's Chart Pattern Recognition
- John Murphy's Market Message
- MurphyExplainsMarketAnalysis-Intermarket Analysis
- MurphyExplainsMarketAnalysis-Visual Analysis
- StockCharts.com
- Technical Analysis of the Financial Markets
- The Visual Investor
- VectorVest, Inc.
- Executive Premier Workshop
- One-Day Options Course
- OptionsPro
- Retirement Income Workshop
- Sure-Fire Trading Systems (VectorVest, Inc.)
- Trading as a Business Workshop
- VectorVest 7 EOD
- VectorVest 7 RealTime/IntraDay
- VectorVest AutoTester
- VectorVest Educational Services
- VectorVest OnLine
- VectorVest Options Analyzer
- VectorVest ProGraphics v6.0
- VectorVest ProTrader 7
- VectorVest RealTime Derby Tool
- VectorVest Simulator
- VectorVest Variator
- VectorVest Watchdog
