HOT TOPICS LIST
- MACD
- Fibonacci
- RSI
- Gann
- ADXR
- Stochastics
- Volume
- Triangles
- Futures
- Cycles
- Volatility
- ZIGZAG
- MESA
- Retracement
- Aroon
INDICATORS LIST
LIST OF TOPICS
PRINT THIS ARTICLE
by Mark Rivest
There's an abundant amount of evidence gathering that indicates October 2015 could have a significant bottom, let's take a look at what's developing.
Position: N/A
Mark Rivest
Independent investment advisor, trader and writer. He has written articles for Technical Analysis of Stocks & Commodities, Traders.com Advantage,Futuresmag.com and, Finance Magnates. Author of website Four Dimension Trading.
PRINT THIS ARTICLE
ELLIOTT WAVE
October Bottom For The Stock Market?
10/07/15 04:13:23 PMby Mark Rivest
There's an abundant amount of evidence gathering that indicates October 2015 could have a significant bottom, let's take a look at what's developing.
Position: N/A
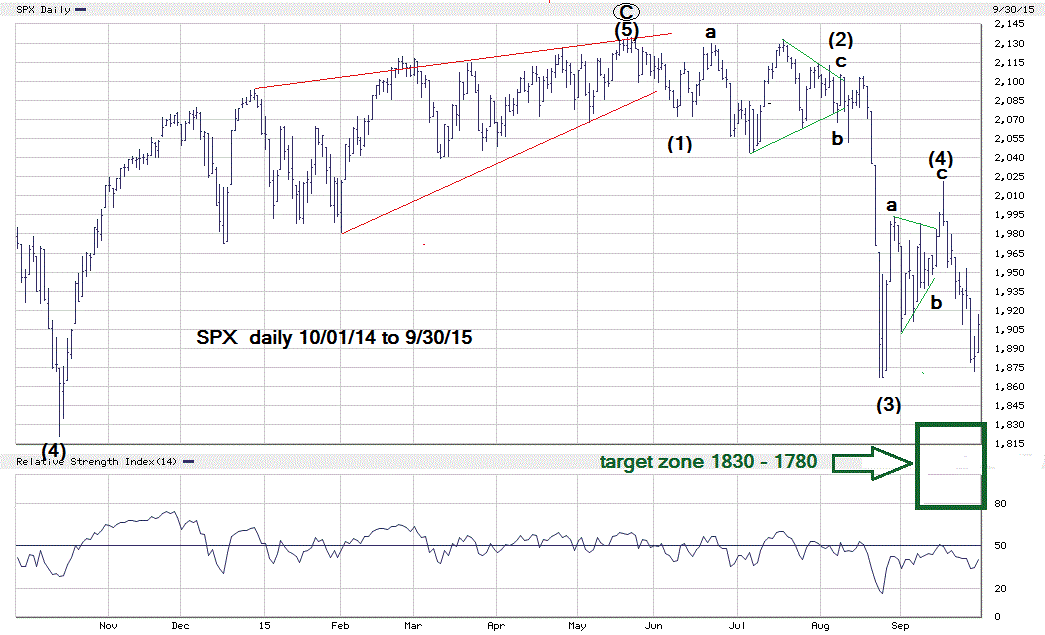
| Have you ever looked at a chart and asked yourself, why didn't I buy at the last bottom? This could be a frustrating experience, especially if it was a bottom similar to the bottom of October 2014 in the major US stock indexes. After October 15, 2014 the S&P 500 (SPX) shot up like a rocket going almost straight up for a month and half before a multi-day pull back occurred. It's hard to buy into a fast rising market because you know there will eventually be a pull back. You're afraid to chase rising prices because you might buy the top tick and face the prospect of holding on to a losing position. Sometimes you could miss a big move up because the market doesn't give you another opportunity to buy. A solution to this problem is to anticipate a market as opposed to following it. To accomplish this you need a methodology to find support & resistance zones. Then you need enough evidence to back up your hypothesis for a bottom or top. SPX Update Take a look at the daily chart of the SPX in Figure 1. Price Dimension: Note that I've changed my wave count from what was illustrated in my September 24 article "Support Becomes Resistance". The reason I did that is because of the complex wave action from May 20, 2015 to early August. There are several different wave interpretations for this time period. The current count is based upon wave actions after early August and wave evidence from some individual stocks. In the stock market, Elliott third waves are usually the longest, strongest and fastest. This describes the sharp August drop in stocks. The subsequent rally off the mini crash bottom looks similar to a three wave correction and a probable fourth wave up. The move down from the supposed wave 4 peak at 2020 so far looks like a new impulse wave down is forming, and is probably the fifth wave down from the May 20, 2015 all time high. Long term support - discussed in several of my articles, remains at SPX 1830-1780. Time Dimension: Seasonally October has been a time when many significant bottoms are made. There is also the possible Fibonacci time cycle due October 16-19. This was discussed in my September 24, 2015 article. This time period remains the most likely for a stock market bottom. There is another time zone due in late October, which I'll discuss more about in a future article if necessary. Sentiment Dimension: The Citigroup Panic/Euphoria model has reached the panic zone and daily put/call ratios have recently recorded high readings, normally seen at bottoms. Market Vane Bullish Consensus is at 53, which is a neutral reading. Sentiment readings are getting close to the area where significant stock market bottoms are made. Momentum Dimension: If the SPX breaks below the August 24, 2015 bottom watch for any bullish momentum divergences. A quick side note: The SPX complex wave action May 20-early August, 2015 presents a great tool for learning how to count difficult Elliott Wave formations. If any Elliott Wave students would like a more detailed explanation of the SPX mid year activity, please feel free to contact me. |

|
| Figure 1. One of several possible SPX wave counts. |
| Graphic provided by: BigCharts.com. |
| |
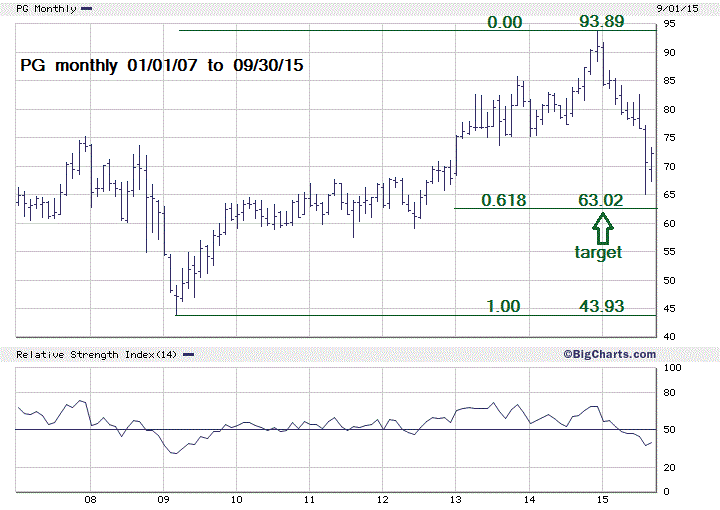
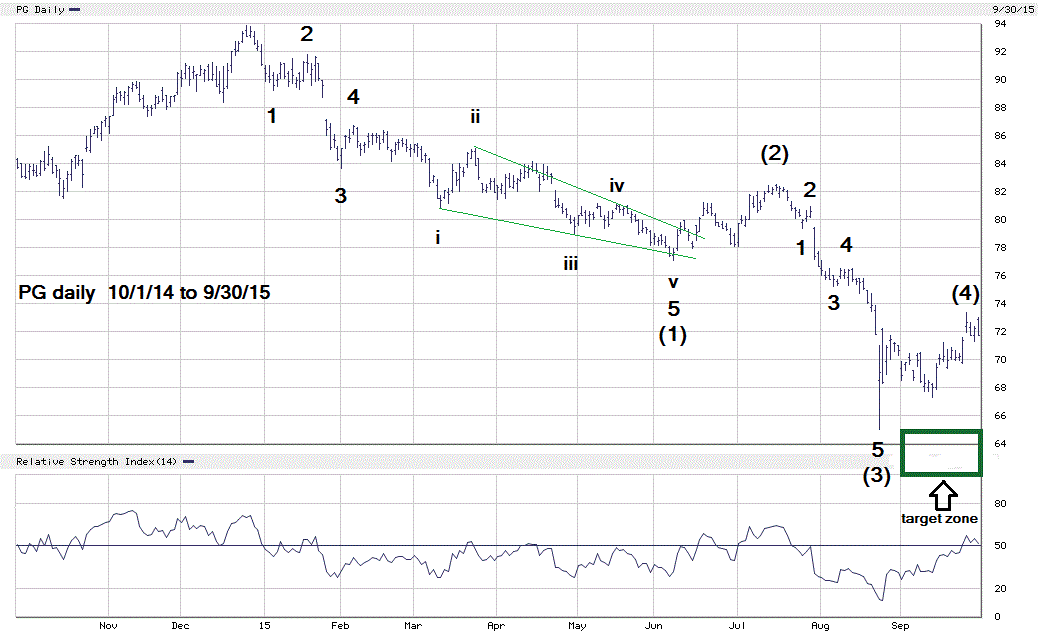
| Proctor & Gamble Proctor & Gamble (PG) could turn out to be one of the most important indicators for the direction of the entire stock market. PG has major support at 63.02, just 2.00 below its August bottom, and an amazingly clear Elliott wave pattern from its peak of 93.89. Please see the monthly chart of PG illustrated in Figure 2. The .618 retracement of the bull move from 43.93 to 93.89 is at 63.02 which also happens to be right in the middle of a three year consolidation range between 58-68. If PG hasn't already bottomed, the 63 area offers powerful support (see Figure 3). The decline of PG from its peak in late December 2014 is a crystal clear Elliott wave pattern. The illustrated wave (1) at the June 2015 bottom has the same wave count as wave (1) down of the Shanghai Composite. Please see my July 27, 2015 article "China Leads The Way". For PG, similar to the Shanghai Composite, wave 5 of (1) is an extended ending diagonal triangle. Within any impulse wave, usually two of the three sub impulse waves will be nearly equal. Wave (1) is 95% of Wave (3). There is a relationship between the two corrective waves as wave (2) is almost .618 of wave (4). Now here's the really good part — Wave 5 usual relationship to wave "one" is equality. Since waves (1) and (3) are near equality the next most likely relationship of wave (5) to (1) is .618. The distance from the start of wave (1) at 93.89 to its end at 77.10 is 16.79 x .618, which yields 10.37. The supposed wave (4) top is at 73.38 - 10.37 = 63.01. Only .01 away from the major Fibonacci support of 63.02. |

|
| Figure 2. PG major support target. |
| Graphic provided by: BigCharts.com. |
| |
| Strategy The ideal scenario would be if in October PG can get to at least 65.01, this is the point of confirmation for wave (5). The broad target zone for a significant PG bottom is 65.01 to 62.00 with 63.01 - 63.02 as the bulls-eye. Also, if the SPX is in the 1830-1780 zone, there would be a good chance for a significant market bottom. The broader time zone is anytime in October, with the 16th and 19th as bulls-eye dates. Evidence is developing of a possible October bottom. Fear is the main reason most of us miss catching bottoms, but it can be overcome by preparation. By anticipating market movements we can reduce or eliminate our fear. Further reading: Frost A.J and Robert Prechter (1985) "Elliott Wave Principle", New Classics Library. |

|
| Figure 3. Crystal clear Elliott wave pattern. |
| Graphic provided by: BigCharts.com. |
| |
Independent investment advisor, trader and writer. He has written articles for Technical Analysis of Stocks & Commodities, Traders.com Advantage,Futuresmag.com and, Finance Magnates. Author of website Four Dimension Trading.
| Website: | www.fourdimensiontrading.com |
| E-mail address: | markrivest@gmail.com |
Click here for more information about our publications!
Comments

|

Request Information From Our Sponsors
- StockCharts.com, Inc.
- Candle Patterns
- Candlestick Charting Explained
- Intermarket Technical Analysis
- John Murphy on Chart Analysis
- John Murphy's Chart Pattern Recognition
- John Murphy's Market Message
- MurphyExplainsMarketAnalysis-Intermarket Analysis
- MurphyExplainsMarketAnalysis-Visual Analysis
- StockCharts.com
- Technical Analysis of the Financial Markets
- The Visual Investor
- VectorVest, Inc.
- Executive Premier Workshop
- One-Day Options Course
- OptionsPro
- Retirement Income Workshop
- Sure-Fire Trading Systems (VectorVest, Inc.)
- Trading as a Business Workshop
- VectorVest 7 EOD
- VectorVest 7 RealTime/IntraDay
- VectorVest AutoTester
- VectorVest Educational Services
- VectorVest OnLine
- VectorVest Options Analyzer
- VectorVest ProGraphics v6.0
- VectorVest ProTrader 7
- VectorVest RealTime Derby Tool
- VectorVest Simulator
- VectorVest Variator
- VectorVest Watchdog
