HOT TOPICS LIST
- MACD
- Fibonacci
- RSI
- Gann
- ADXR
- Stochastics
- Volume
- Triangles
- Futures
- Cycles
- Volatility
- ZIGZAG
- MESA
- Retracement
- Aroon
INDICATORS LIST
LIST OF TOPICS
PRINT THIS ARTICLE
by Mark Rivest
S&P 500 hits resistance, has a decline into October begun?
Position: N/A
Mark Rivest
Independent investment advisor, trader and writer. He has written articles for Technical Analysis of Stocks & Commodities, Traders.com Advantage,Futuresmag.com and, Finance Magnates. Author of website Four Dimension Trading.
PRINT THIS ARTICLE
SUPPORT & RESISTANCE
Support Becomes Resistance
09/24/15 03:27:27 PMby Mark Rivest
S&P 500 hits resistance, has a decline into October begun?
Position: N/A
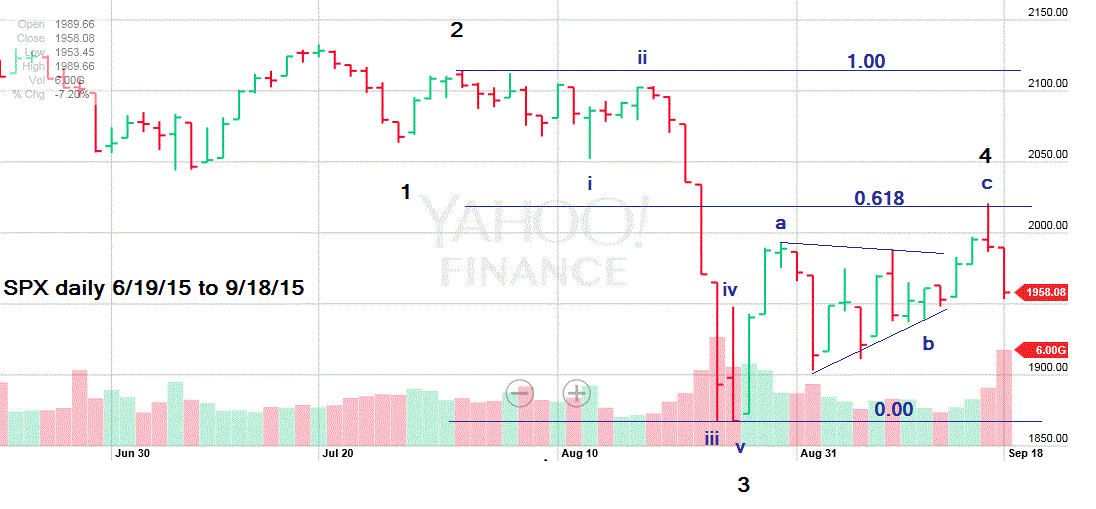
| For several months the S&P 500 (SPX) level of 2040 was very important support. After the August mini crash break through it has now become very important resistance and will likely keep the bulls in check for at least the next several months. Meanwhile evidence indicates a new down wave has begun that will likely take the SPX below its August 24th bottom before the end of October. Price Dimension The reason that SPX 2040 is now important resistance is because the fast break below this level probably caught many traders and investors by surprise. They are probably still holding many long positions purchased above 2040 and are looking to exit these positions at the best possible price. It will likely take a few rallies up to 2040 to break through this overhead resistance. On September 17th after the FOMC announcement the SPX rallied to 2020 and then decisively moved down, which proves there is considerable selling power in the zone just below 2040. The specific level of 2020 also provides a very important clue as to the near term direction of the stock market. Please see the SPX daily chart 6/19/15 to 9/18/15 illustrated in Figure 1. Note that the SPX peaked not at .618 retrace of the decline from the top at 2132 made on July 20th but at a .618 retrace of the decline from the top at 2114 made on July 31st. This may not seem very important, but it is in terms of Elliott wave analysis. Corrections of Elliott five wave impulses usually stop at Fibonacci retrace points, such as .382, .50 and .618. The closer a correction can get to a Fibonacci point increases the chance that a market turn will hold. The exact level of the .618 retrace of the decline from 2114..24 to 1867.01 is 2019.79, the peak on September 17th was 2020.86. Additionally, the rally from August 25th to September 17th counts as a corrective three wave rally. The conclusion of the Elliott wave and Fibonacci evidence strongly implies that a five wave pattern down from the July 20th top is under construction. The decline after the SPX peak at 2020 is probably the fifth wave with a probable end in the 1830 to 1780 support zone. |

|
| Figure 1. Daily S&P 500 (SPX) chart. |
| Graphic provided by: Yahoo! Finance. |
| |
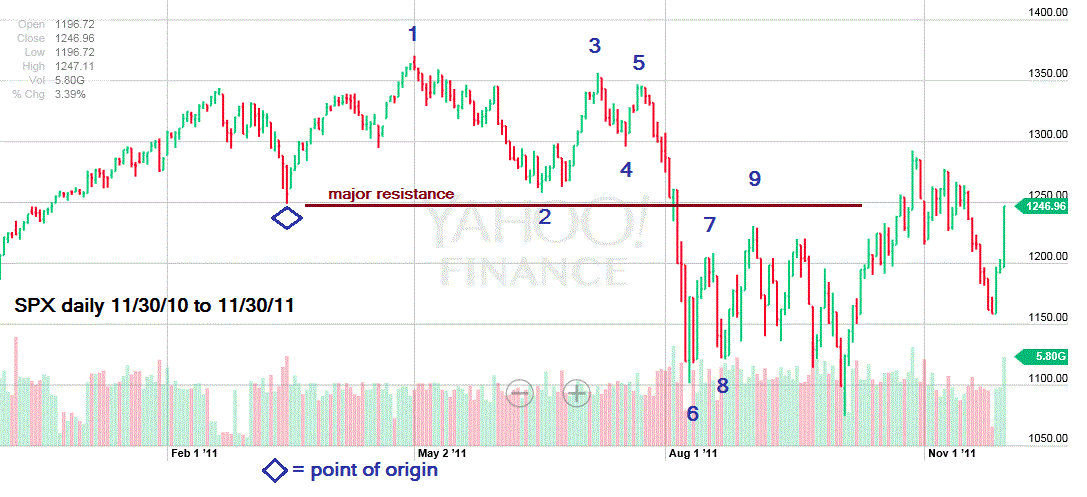
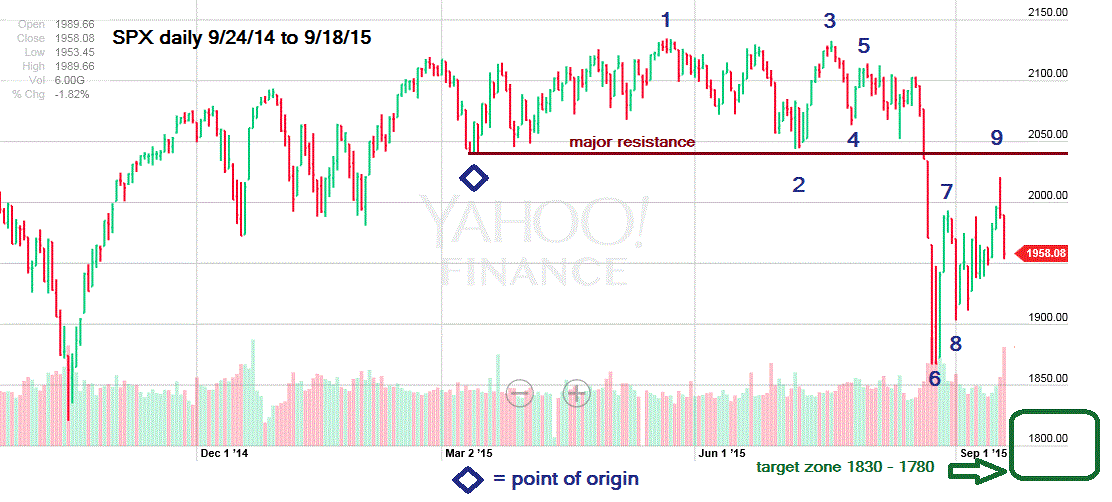
| Time Dimension Amazingly the SPX in 2015 continues to track the progress of the SPX of May to October 2011. Please see the SPX daily chart 11/30/10 to 11/30/11 in Figure 2 and the SPX daily chart 9/24/14 to 9/18/15 in Figure 3. Point "9" on the 2011 chart corresponds to the peak made on September 17, 2015. If the tracking of 2011 continues the SPX should decline below the August 24, 2015 bottom sometime in October. The strong seasonal pattern of stock market declines in October also backs up this theory. October stock market declines are so notorious that even laymen are aware of them. October is also a month when important bottoms are made. In my September 15th article "Adding Fuel To The Fire" noted a possible Fibonacci time zone turn on September 14th. As it turned out that day had no significant turn, there is however another possible Fibonacci time turn coming in October. Adding 89 days to the SPX top made on July 20th targets Saturday October 17th . Adding 55 days to the August 24th bottom targets Sunday October 18th. The nearest trading days are October 16th and 19th . By the way October 19th is the anniversary (or as I like to call it, the "crashaversary") of the 1987 stock market crash. If the stock market is declining into the October 16 to 19 time zone there is a high probability a bottom could be forming. |

|
| Figure 2: SPX daily chart from 2011. |
| Graphic provided by: Yahoo! Finance. |
| |
| Momentum Dimension In my September 15th article I noted that the sharp drop of the Dow Jones Utility Average from its August 20th top was adding fuel to the bearish fire. What could nullify that bearish fuel is the recent relative strength of the NASDAQ (COMP). On September 17th the COMP had retraced over 71% of its decline from the July 20th all-time high. This is well above the .618 resistance level and opens the door for this index to rally all the way back to the all time high. If the SPX declines below the August 24th bottom and the COMP fails to breach its bottom made on August 24th this could be a major clue of a bottom forming. Elliott wave patterns and Fibonacci times cycles point to a decline into October. The next important support zone is SPX 1830-1780. The bulls-eye time zone is October 16-19. While this scenario provides the greatest probability of a bottom, be prepared for a potential bottom if at any time between now and the end of October the SPX is trading in the 1830-1780 zone. |

|
| Figure 3. The 2015 SPX daily chart shows price movement similar to what happened in 2011. |
| Graphic provided by: Yahoo! Finance. |
| |
Independent investment advisor, trader and writer. He has written articles for Technical Analysis of Stocks & Commodities, Traders.com Advantage,Futuresmag.com and, Finance Magnates. Author of website Four Dimension Trading.
| Website: | www.fourdimensiontrading.com |
| E-mail address: | markrivest@gmail.com |
Click here for more information about our publications!
PRINT THIS ARTICLE

|

Request Information From Our Sponsors
- StockCharts.com, Inc.
- Candle Patterns
- Candlestick Charting Explained
- Intermarket Technical Analysis
- John Murphy on Chart Analysis
- John Murphy's Chart Pattern Recognition
- John Murphy's Market Message
- MurphyExplainsMarketAnalysis-Intermarket Analysis
- MurphyExplainsMarketAnalysis-Visual Analysis
- StockCharts.com
- Technical Analysis of the Financial Markets
- The Visual Investor
- VectorVest, Inc.
- Executive Premier Workshop
- One-Day Options Course
- OptionsPro
- Retirement Income Workshop
- Sure-Fire Trading Systems (VectorVest, Inc.)
- Trading as a Business Workshop
- VectorVest 7 EOD
- VectorVest 7 RealTime/IntraDay
- VectorVest AutoTester
- VectorVest Educational Services
- VectorVest OnLine
- VectorVest Options Analyzer
- VectorVest ProGraphics v6.0
- VectorVest ProTrader 7
- VectorVest RealTime Derby Tool
- VectorVest Simulator
- VectorVest Variator
- VectorVest Watchdog
