HOT TOPICS LIST
- MACD
- Fibonacci
- RSI
- Gann
- ADXR
- Stochastics
- Volume
- Triangles
- Futures
- Cycles
- Volatility
- ZIGZAG
- MESA
- Retracement
- Aroon
INDICATORS LIST
LIST OF TOPICS
PRINT THIS ARTICLE
by Mark Rivest
Clues of why late December 2015 could be a terrific time to buy stocks.
Position: N/A
Mark Rivest
Independent investment advisor, trader and writer. He has written articles for Technical Analysis of Stocks & Commodities, Traders.com Advantage,Futuresmag.com and, Finance Magnates. Author of website Four Dimension Trading.
PRINT THIS ARTICLE
MARKET TIMING
The Time Factor
12/16/15 04:39:52 PMby Mark Rivest
Clues of why late December 2015 could be a terrific time to buy stocks.
Position: N/A
| In my December 8th article, "Three Paths To Profits", the focus was on the price paths the Standard & Poor's 500 Index (SPX) could take to the 1990 level or even to as low as 1850. This article's focus is on the time factor, but first an examination of one of the price paths mentioned in the December 8th article. Price Figure 1 of the December 8th article illustrated the SPX forming a possible Elliott wave Ending Diagonal Triangle (EDT) from the August 24th bottom. As it turned out, the Nasdaq (COMP) completed a near text book EDT pattern from its August 24th bottom on December 2nd. However, the December 2nd peak was below the supposed COMP third wave peak made on July 20th which in Elliott wave is referred to as a truncated fifth wave. Roughly 85-90% of the time a fifth wave will exceed the end point of a third wave, this automatically makes any possible truncated fifth wave a low probability wave count. What about the SPX? Its December 2nd peak failed to exceed the high made on November 3rd making the entire price structure from the August 24th bottom a very rare double truncated fifth wave. The Dow Jones Industrial Average's December 2nd peak wasn't even able exceed a very short term high made on November 20th. Low probability does not mean no probability. If stock prices continue to decline into January, the EDT count will be revisited. |

|
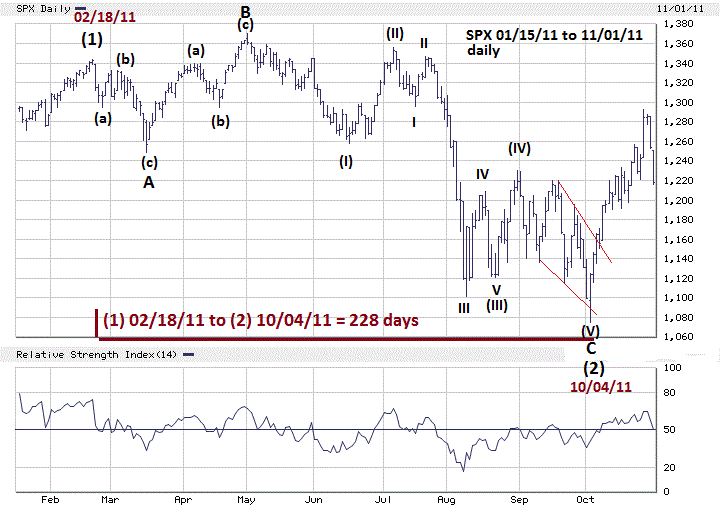
| Figure 1. The SPX 2011 correction could provide a clue to a bottom in 2015. |
| Graphic provided by: BigCharts.com. |
| |
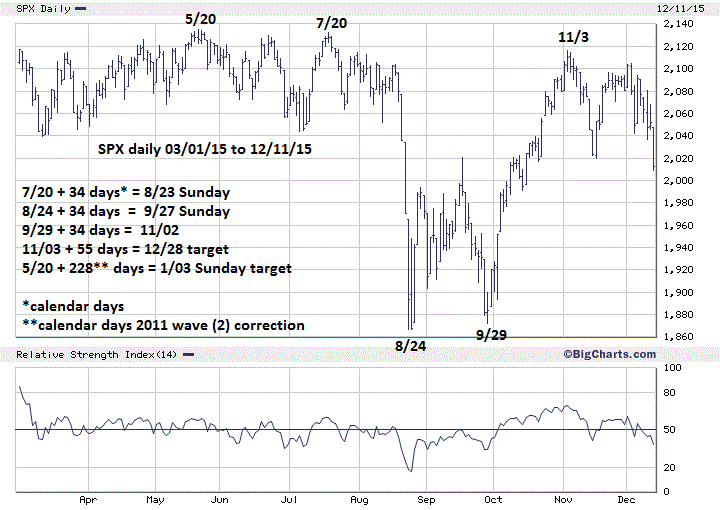
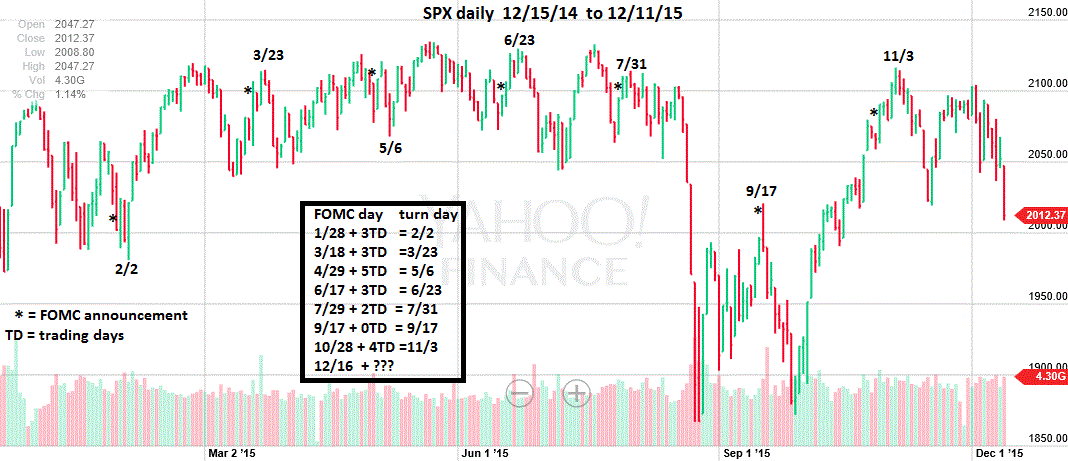
| Time First an update on the major Fibonacci time cycle discussed in my November 30th article "Stock Market Building A Base?" Sunday, December 6th was the bulls-eye target with early December as the broader time zone. The turn came as a peak on December 2nd. Considering that the coordinates for this time cycle are four and six years ago, missing by only four calendar days is still very close. Several of my articles in particular the August 10th article "Analyze This" noted the similarities between the SPX 2011 correction and the SPX of 2015. In Elliott wave terms the 2011 correction is a possible wave "Two" of a possible developing five wave impulse up from the June 2010 bottom. The 2015, possible still developing decline would be wave "Four" of the larger five wave pattern. Waves "Two" and "Four" are typically equal in time. Now here's the interesting part, in Elliott wave terms the 2011 correction began at the February peak, not the May high. Please see the illustrated SPX 2011 daily chart in Figure 1. The Elliott wave pattern from the February 2011 peak to the October 2011 bottom is a text book Expanding Flat correction. This pattern in a rising market begins with three waves down followed by three waves up to at least marginally above the point of origin of the three waves down. The Expanding Flat completes with five waves down that exceeds the end point of the initial three waves down. The entire 2011 Expanding Flat completed in 228 calendar days. Add these 228 days to the 2015 high of May 20th targets Sunday, January 3, 2016 as a possible ending point for wave "Four". Another interesting time factor is that since the July 20th peak the SPX has been making turns after approximately 34 calendar days. Please see the illustrated SPX 2015 daily chart in Figure 2. 34 is one of the numbers in the Fibonacci sequence (which is; 1,1,2,3,5,8,13,21,34,55,89, etc). The decline from the November 3rd peak has already exceeded 34 calendar days, perhaps this time the SPX will bottom after 55 calendar days which is the next number in the sequence. If so, adding 55 calendar days after November 3rd targets December 28th as a possible, bottom. There have been seven FOMC announcements in 2015. After almost all of them the SPX continued trending in the same direction as it had been traveling before the announcement. September 17th being the sole exception — the SPX turned on that day. Please see the illustrated SPX 2014-2015 chart in Figure 3. The post announcement trend has lasted 2-5 trading days. Assuming the SPX declines into the FOMC day, five trading days after the FOMC announcement December 16th targets December 23rd. Christmas, December 25th, has a full moon so there is also the possibility of a lunar cycle turn. |

|
| Figure 2. After the July 20 top the SPX has had three moves of 34 calendar days. |
| Graphic provided by: BigCharts.com. |
| |
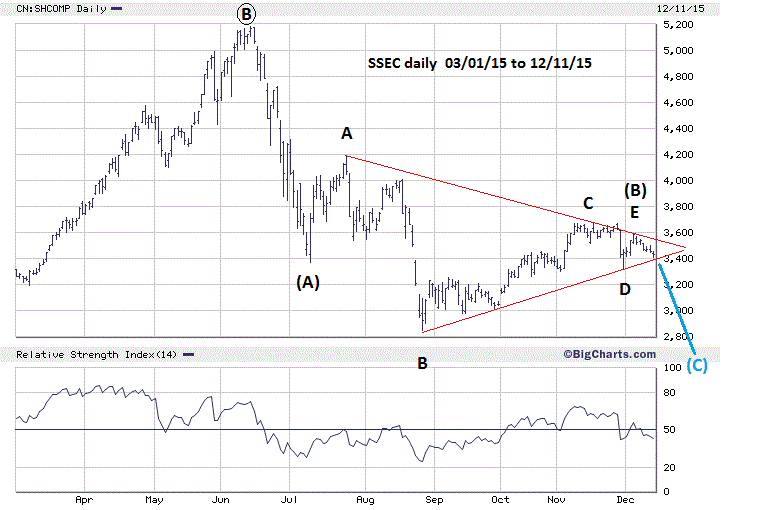
| Shanghai Composite and Summary In my December 8th article Figure 4 illustrated that the Shanghai Composite (SSEC) was nearing completion of a Horizontal Triangle from the July bottom. This pattern is now complete at the December 3rd peak of 3591.73 and represents the termination of wave (B) of a three wave Zigzag forming from the June peak. Zigzag wave (A) is usually equal to wave (C) or related by the .618 Fibonacci ratio. The wave (A) decline was 34.8% x.618 = 21.5%. A 21.5% decline from 3591.73 targets 2819.51, which is close to the 2850.71 August bottom and represents the minimal downside target for the probable developing post triangle thrust down. China is the key to triggering another mini crash worldwide. Recall that in August the Chinese stock indices were declining in tandem with the crude oil market. The same is happening in December. Therefore, the most likely path for the SPX to follow is a bottom near major Fibonacci support at 1850, sometime after the FOMC and before the end of the year. December 28th is a good candidate for the bulls-eye because there is precedent for the stock market to have sharp declines in 55 calendar days. August-October 1987 is a good example. If in next few weeks the SPX can breech the August 24th bottom at 1867 it will be viewed by many as a cause for fear. For those of us with knowledge of the time factor and price support levels it will be viewed as an opportunity. An opportunity that could reap an abundant harvest of profits in 2016. Further reading: Frost A.J and Robert Prechter (1985) "Elliott Wave Principle", New Classics Library. |

|
| Figure 3. SPX and FOMC announcements. |
| Graphic provided by: Yahoo! Finance. |
| |

|
| Figure 4. The Shanghai Composite Horizontal Triangle is complete at the December 3rd peak. |
| Graphic provided by: BigCharts.com. |
| |
Independent investment advisor, trader and writer. He has written articles for Technical Analysis of Stocks & Commodities, Traders.com Advantage,Futuresmag.com and, Finance Magnates. Author of website Four Dimension Trading.
| Website: | www.fourdimensiontrading.com |
| E-mail address: | markrivest@gmail.com |
Click here for more information about our publications!
PRINT THIS ARTICLE

Request Information From Our Sponsors
- VectorVest, Inc.
- Executive Premier Workshop
- One-Day Options Course
- OptionsPro
- Retirement Income Workshop
- Sure-Fire Trading Systems (VectorVest, Inc.)
- Trading as a Business Workshop
- VectorVest 7 EOD
- VectorVest 7 RealTime/IntraDay
- VectorVest AutoTester
- VectorVest Educational Services
- VectorVest OnLine
- VectorVest Options Analyzer
- VectorVest ProGraphics v6.0
- VectorVest ProTrader 7
- VectorVest RealTime Derby Tool
- VectorVest Simulator
- VectorVest Variator
- VectorVest Watchdog
- StockCharts.com, Inc.
- Candle Patterns
- Candlestick Charting Explained
- Intermarket Technical Analysis
- John Murphy on Chart Analysis
- John Murphy's Chart Pattern Recognition
- John Murphy's Market Message
- MurphyExplainsMarketAnalysis-Intermarket Analysis
- MurphyExplainsMarketAnalysis-Visual Analysis
- StockCharts.com
- Technical Analysis of the Financial Markets
- The Visual Investor
