HOT TOPICS LIST
- MACD
- Fibonacci
- RSI
- Gann
- ADXR
- Stochastics
- Volume
- Triangles
- Futures
- Cycles
- Volatility
- ZIGZAG
- MESA
- Retracement
- Aroon
INDICATORS LIST
LIST OF TOPICS
PRINT THIS ARTICLE
by Mark Rivest
Momentum and sentiment indicators signal that on January 15, 2016 an important bottom for both stocks and Crude Oil may be in place.
Position: N/A
Mark Rivest
Independent investment advisor, trader and writer. He has written articles for Technical Analysis of Stocks & Commodities, Traders.com Advantage,Futuresmag.com and, Finance Magnates. Author of website Four Dimension Trading.
PRINT THIS ARTICLE
SUPPORT & RESISTANCE
The Signature of an Important Bottom
01/22/16 05:55:36 PMby Mark Rivest
Momentum and sentiment indicators signal that on January 15, 2016 an important bottom for both stocks and Crude Oil may be in place.
Position: N/A
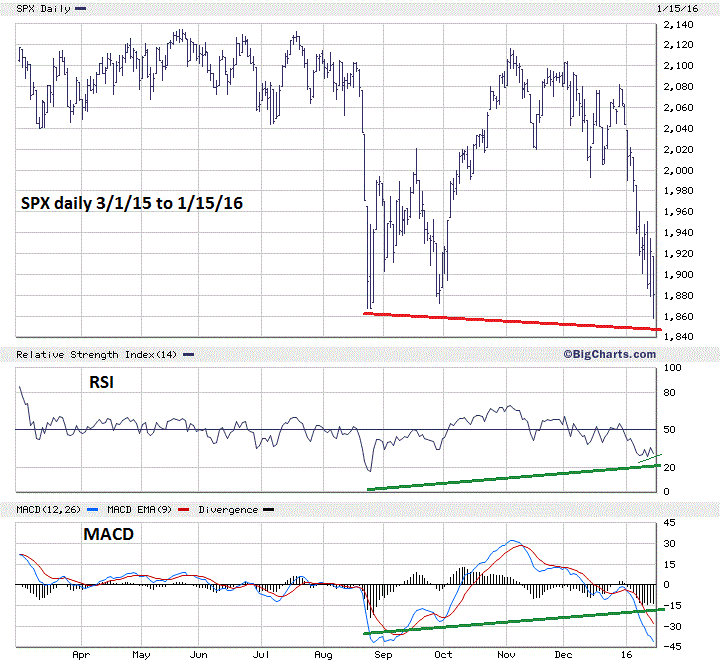
| My November 11th, 2015 article "Winning In The Bullish Season" noted a Fibonacci relationship with the 2011 S&P 500 (SPX) correction that targeted SPX 1850 as the bulls-eye target bottom for the decline that began on May 20th 2015. My December 8th, 2015 article "Three Paths To Profits" noted a second Fibonacci coordinate that targeted SPX 1848 as the bottom for a decline from the secondary peak made on November 3rd 2015. On January 15, 2016 the SPX reached a low of 1857.83 which is within reasonable leeway of the two important Fibonacci points. At the close of trading on January 15th, many momentum and sentiment indicators for both stocks and Crude Oil were screaming that a very important bottom may have been made. Let's look at the evidence. SPX Momentum and Sentiment My January 6th article "The Intersection Of Price And Time" noted the SPX possibly bottoming at 1950 on January 8th. What resulted is a great example of market action if a Fibonacci price target is exceeded. On January 7th the SPX low was 1938.83 which is the low end of the leeway for the 1950 bulls-eye target. The next day the SPX went below 1938 indicating a probable miss of that Fibonacci target. Fibonacci points are like magnets, usually if a market breaks through one point it means it's being drawn to the next magnet, which in this case is the two Fibonacci points in the 1850 area. Please see the daily SPX chart illustrated in Figure 1. Note that the daily RSI and MACD histogram have bullish divergences vs. the bottom made on August 24th. In addition, there's a bullish divergence among the three main US stock indices, with the SPX breaking below its August 24th bottom while the Dow Jones Industrial Average and the Nasdaq Composite hold above their respective August 24th bottoms. The SPX A/D line on January 15th had a reading of 5344 which is above the readings made at the August 24th bottom of 5314 and the September 29th bottom reading of 5311. In the dimension of sentiment, the total put/call reading on January 15th was 1.52 — the highest reading in more than twelve months. The next highest reading was 1.48 made on August 21st. |

|
| Figure 1. SPX Daily. |
| Graphic provided by: BigCharts.com. |
| |
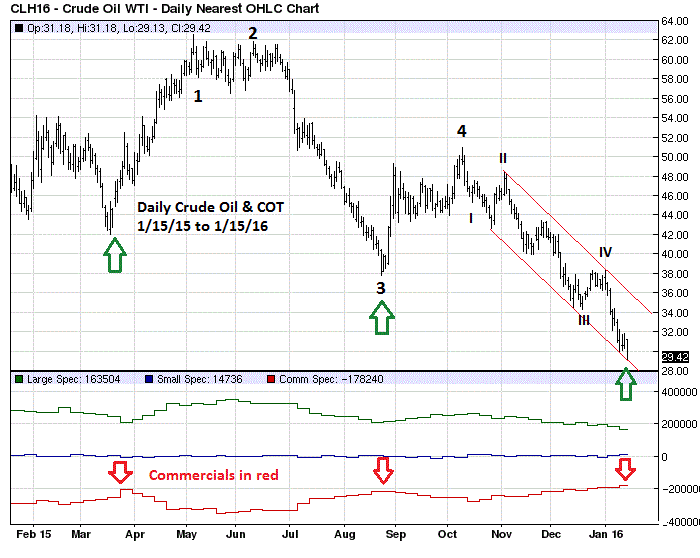
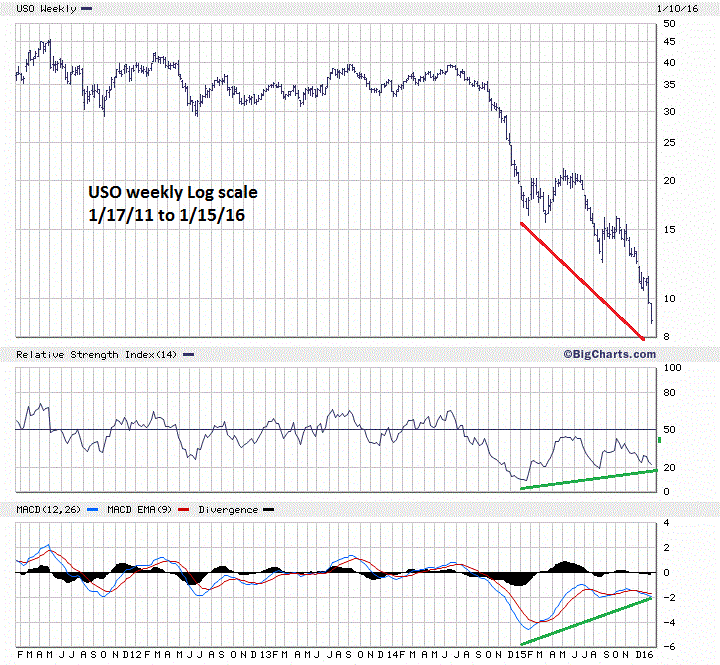
| Crude Oil Momentum And Sentiment Please see the daily Crude Oil chart illustrated in Figure 2. First note the extremely clear five wave Elliott pattern from the May 2015 peak. This chart is a beauty, a text book Elliott impulse wave. Anyone interested in learning Elliott wave theory should keep this chart as a guide. The lower part of the chart illustrates Commitment of Traders (COT). Traders are classified into three categories: small, large and commercial speculators. The commercials are the group to watch as they hold the most futures contracts. It's not surprising that after several years of a Crude Oil bear market that they are still net short, but notice they have had their smallest short positions near the March and August 2015 bottoms. The reading at the January 15th low is the smallest short position in more than a year. Please see the Weekly United States Oil (USO) ETF chart illustrated in Figure 3. In terms of momentum the weekly RSI and MACD are showing a double bullish divergence vs. the bottoms made in January and August 2015. Another very interesting bullish divergence occurred on January 15th when Crude Oil made a new bear market low, both the energy sector ETF (XLE) and the Oil and gas index (XOI) failed to go below their respective bottoms made two days earlier. Stocks and Crude Oil have been roughly trading together; the most striking example took place at the August 24th bottom. Perhaps they're doing the same on January 15, 2016. |

|
| Figure 2. Daily Crude Oil (CLH16). |
| Graphic provided by: Barcharts.com. |
| |
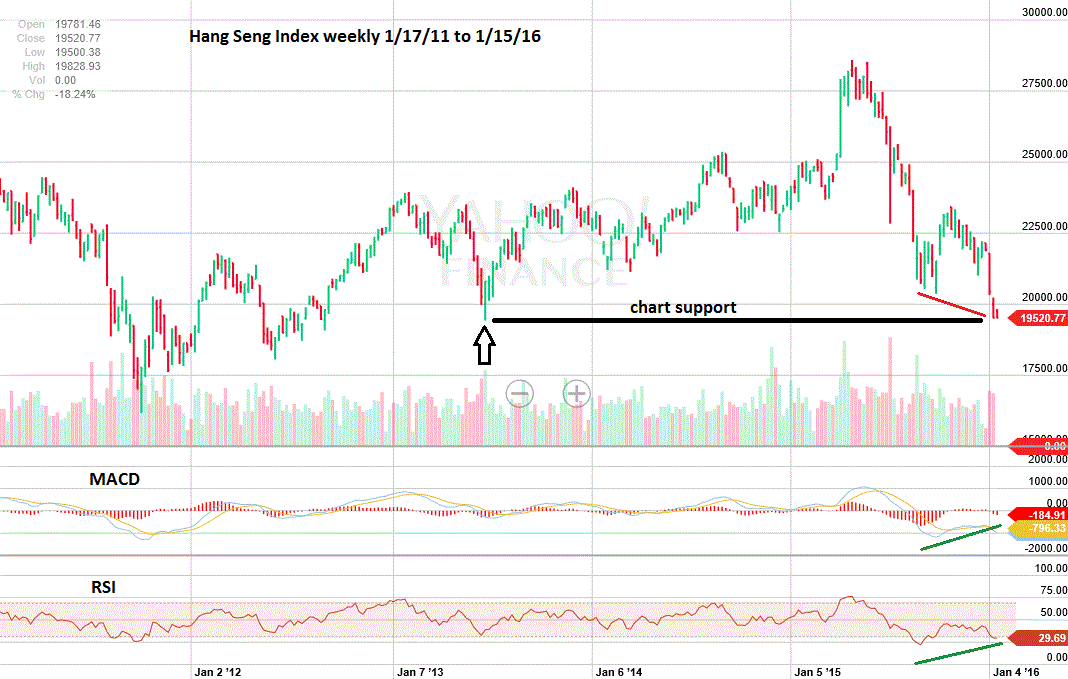
| Hang Seng Momentum One of the most bearish stock indexes in the world has been the Hang Seng index (HSI). Please see the weekly HSI chart illustrated in Figure 4. Even this index is showing signs of a possible bottom with both the weekly RSI and MACD showing bullish divergences. Also note the HSI is now trading in the area of important chart support of the 2013 low. |

|
| Figure 3. USO Weekly. |
| Graphic provided by: BigCharts.com. |
| |
| Strategy The January 6th article recommended using 2% below SPX 1948 as a guide for stop losses on long positions. This was triggered when the SPX went below 1909. Start entering long positions immediately, use SPX 1760 as a stop loss guide. Continue to focus on large cap stocks that have been outperforming the broader market averages. There's a direct relationship between the size of a market turn and the number of technical indicator signaling a turn. The vast amount of sentiment and momentum evidence suggests that stocks and Crude Oil could be on the verge of rallies lasting several months. If a bullish turn does occur in mid-January 2016, remember what the indicators were saying, because it will happen again. |

|
| Figure 4: Hang Seng Index Weekly. |
| Graphic provided by: Yahoo! Finance. |
| |
| Further reading: Frost A.J and Robert Prechter (1985) "Elliott Wave Principle", New Classics Library. |
Independent investment advisor, trader and writer. He has written articles for Technical Analysis of Stocks & Commodities, Traders.com Advantage,Futuresmag.com and, Finance Magnates. Author of website Four Dimension Trading.
| Website: | www.fourdimensiontrading.com |
| E-mail address: | markrivest@gmail.com |
Click here for more information about our publications!
Comments
Date: 02/11/16Rank: 1Comment:

Request Information From Our Sponsors
- StockCharts.com, Inc.
- Candle Patterns
- Candlestick Charting Explained
- Intermarket Technical Analysis
- John Murphy on Chart Analysis
- John Murphy's Chart Pattern Recognition
- John Murphy's Market Message
- MurphyExplainsMarketAnalysis-Intermarket Analysis
- MurphyExplainsMarketAnalysis-Visual Analysis
- StockCharts.com
- Technical Analysis of the Financial Markets
- The Visual Investor
- VectorVest, Inc.
- Executive Premier Workshop
- One-Day Options Course
- OptionsPro
- Retirement Income Workshop
- Sure-Fire Trading Systems (VectorVest, Inc.)
- Trading as a Business Workshop
- VectorVest 7 EOD
- VectorVest 7 RealTime/IntraDay
- VectorVest AutoTester
- VectorVest Educational Services
- VectorVest OnLine
- VectorVest Options Analyzer
- VectorVest ProGraphics v6.0
- VectorVest ProTrader 7
- VectorVest RealTime Derby Tool
- VectorVest Simulator
- VectorVest Variator
- VectorVest Watchdog
