

HOT TOPICS LIST
- MACD
- Fibonacci
- RSI
- Gann
- ADXR
- Stochastics
- Volume
- Triangles
- Futures
- Cycles
- Volatility
- ZIGZAG
- MESA
- Retracement
- Aroon
INDICATORS LIST
LIST OF TOPICS
PRINT THIS ARTICLE
by Mark Rivest
Find out why the S&P 500 reaching 1950 on January 8, 2016 could be an important bottom.
Position: N/A
Mark Rivest
Independent investment advisor, trader and writer. He has written articles for Technical Analysis of Stocks & Commodities, Traders.com Advantage,Futuresmag.com and, Finance Magnates. Author of website Four Dimension Trading.
PRINT THIS ARTICLE
SUPPORT & RESISTANCE
The Intersection of Price and Time
01/06/16 04:29:41 PMby Mark Rivest
Find out why the S&P 500 reaching 1950 on January 8, 2016 could be an important bottom.
Position: N/A
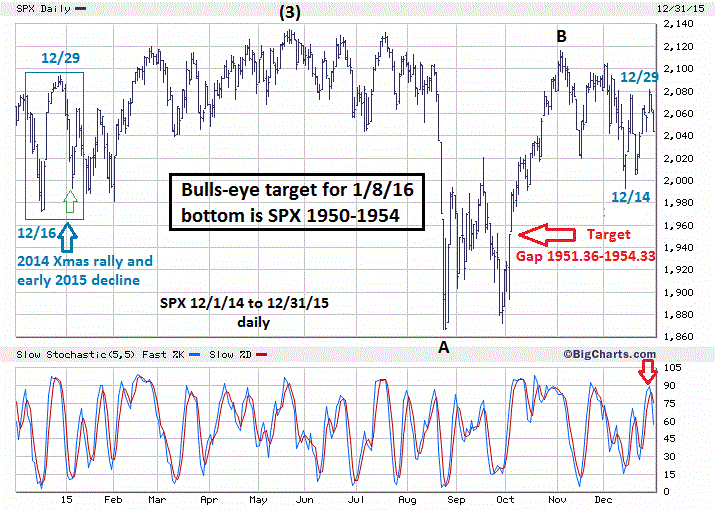
| Since May 20, 2015 the S&P 500 (SPX) has been forming what appears to be an Elliott wave Horizontal Triangle. The decline in the last two trading days of 2015 could lead to significant Fibonacci support at SPX 1950 on a very important Fibonacci time cycle. Clues from late 2014-early 2015 trading provide a road map to what may happen in early 2016. Time and Price Please see the daily SPX chart illustrated in Figure 1. On December 16, 2014 the SPX started a rally that peaked on the 29th, the last two trading days of 2014 were down and continued to decline into the first trading week of 2015. A repeat of this phenomenon appears to be underway with the 2015 SPX rally beginning on December 14th and again topping on the 29th. An exact duplication of the 2014/2015 decline targets January 6, 2016 as a possible bottom. This is very close to the Fibonacci time cycle due on January 8th which was illustrated in my December 30th article "One Path To Profits". In addition the monthly employment report is due on the 8th. Saturday the 9th is a new moon and the last lunar cycle turn came on September 28th — we're due. As for price, my December 30th article noted a .618 Fibonacci relationship of the SPX May-August decline subtracted from the November 3rd top targeted 1951.04. The possible Double Zigzag count from November 3rd is still a valid wave count except the supposed "x" wave peak has been raised to the December 29th top at 2081.56. Subtracting 123.22 (the length of the first Zigzag) from 2081.56 targets 1958.34. In addition to these two Fibonacci coordinates is a gap at 1951.36-1954.33. If the SPX was to break below 1990 there is no chart or Fibonacci support until 1958. The combination of two Fibonacci coordinates and gap support provide a powerful magnet to draw prices down. |
|
| Figure 1. Clues from late 2014-early 2015 trading provide a road map to what may happen in 2016. |
| Graphic provided by: BigCharts.com. |
| |
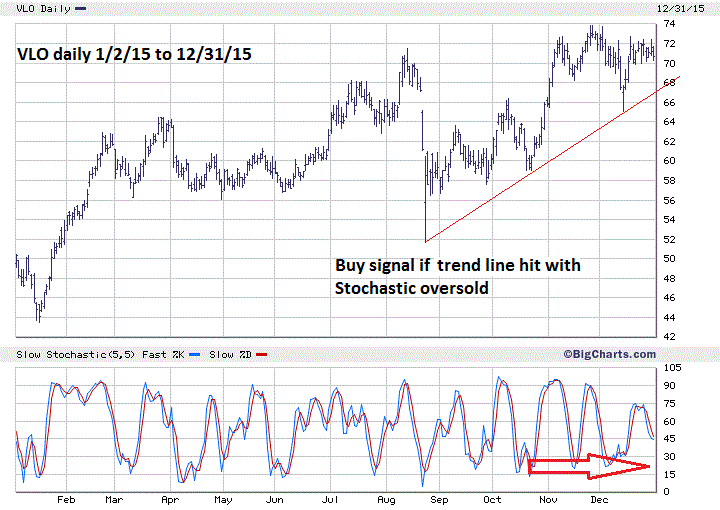
| Momentum All three of the main US stock indices have had impressive rebounds from their mid 2015 declines. The Dow Jones Industrial Average has retraced 87.4%, the SPX 93.1% and Nasdaq composite 94.1%. While such deep retracements are no guarantee that any of the indices will make new all-time highs, they are a strong clue of higher prices to come in 2016. Most of the time the maximum retrace of a bearish move is in the range of 61-66%. Additional bullish strength has been exhibited in three of the SPX sector ETF's. Consumer Staples (XLP) Consumer Discretionary (XLY) and Technology (XLK) have all retraced more than 100% of the declines into their August 24th bottoms. As late as December, XLP and XLK were continuing to make all-time highs. If a bear market is developing, why are any sector ETF's able to make new highs many months after the main US indices have made their respective peaks? Shifting the focus to individual stocks, bullish strength can be found in many sectors, even the weak energy sector. Please examine the daily chart of Valero Energy Corp (VLO) illustrated in Figure 2. VLO appears to be building a base for a push to a new 52-week high. VLO is a great stock to buy if it can hit its rising trend line in the next few days. Some other powerhouse stocks to keep an eye on are; Facebook (FB), Amazon.com (AMZN), and Constellation Brands (STZ). Watch for an oversold condition on the daily Slow Stochastic as a guide to buying these stocks. |
|
| Figure 2. VLO appears to be building a base for a push to a new 52 week high. |
| Graphic provided by: BigCharts.com. |
| |
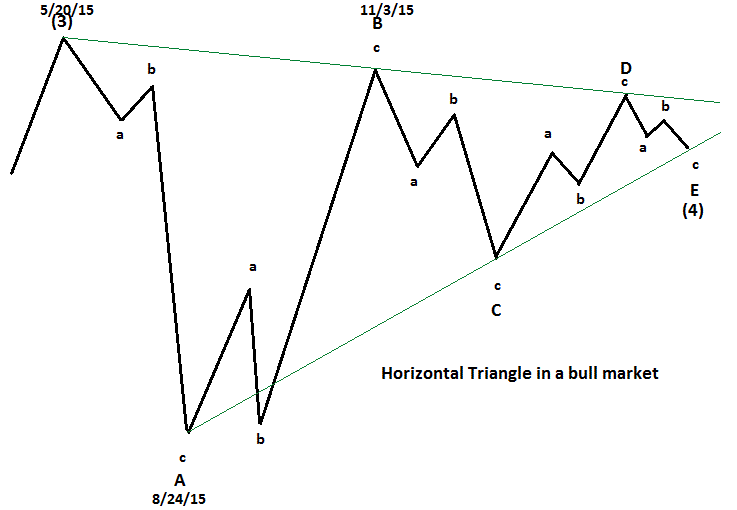
| Strategy Please see the illustration of an Elliott wave Horizontal Triangle in Figure 3. This pattern is the most likely course the SPX could be taking since the May 20th peak. Where the SPX is within the pattern will probably be revealed in the first week of 2016. The primary count has the SPX making a bottom near 1950 — this would mark the completion of wave "C". If, however, the SPX fails to break below the bottom of 1993.26 made on December 14th the SPX could be in wave "E". In this scenario after the completion of wave "E", the SPX would begin a post triangle thrust up, and likely make new all-time highs in just a few weeks. My December 30th article recommended exiting inverse funds used for hedging if the December 16th high was exceeded, which the SPX did on December 29th. There is a moderate probability that the SPX is in wave "E" of the Horizontal Triangle. Therefore, do not reestablish hedging positions. Begin new long positions if the SPX breaks below 1970, get very aggressive if the SPX is trading between 1948-1955 on January 8th. Use 2% below SPX 1948 as a guideline for stop losses on any long positions. If the SPX has failed to break below 1993.26 by the first hour of trading on January 8th begin new long positions. Use 1993.26 as a guideline for a stop loss. The dimensions of price and time are like longitude and latitude on a map. Knowledge of patterns and cycles helps to keep you on the path of profits. |
|
| Figure 3. This pattern is the most likely course the SPX could be taking since the May 20th peak. |
| Graphic provided by: provided by: Mark Rivest.. |
| |
| Further reading: Frost A.J and Robert Prechter (1985) "Elliott Wave Principle", New Classics Library. |
Independent investment advisor, trader and writer. He has written articles for Technical Analysis of Stocks & Commodities, Traders.com Advantage,Futuresmag.com and, Finance Magnates. Author of website Four Dimension Trading.
| Website: | www.fourdimensiontrading.com |
| E-mail address: | markrivest@gmail.com |
Click here for more information about our publications!
Comments

Request Information From Our Sponsors
- StockCharts.com, Inc.
- Candle Patterns
- Candlestick Charting Explained
- Intermarket Technical Analysis
- John Murphy on Chart Analysis
- John Murphy's Chart Pattern Recognition
- John Murphy's Market Message
- MurphyExplainsMarketAnalysis-Intermarket Analysis
- MurphyExplainsMarketAnalysis-Visual Analysis
- StockCharts.com
- Technical Analysis of the Financial Markets
- The Visual Investor
- VectorVest, Inc.
- Executive Premier Workshop
- One-Day Options Course
- OptionsPro
- Retirement Income Workshop
- Sure-Fire Trading Systems (VectorVest, Inc.)
- Trading as a Business Workshop
- VectorVest 7 EOD
- VectorVest 7 RealTime/IntraDay
- VectorVest AutoTester
- VectorVest Educational Services
- VectorVest OnLine
- VectorVest Options Analyzer
- VectorVest ProGraphics v6.0
- VectorVest ProTrader 7
- VectorVest RealTime Derby Tool
- VectorVest Simulator
- VectorVest Variator
- VectorVest Watchdog