HOT TOPICS LIST
- MACD
- Fibonacci
- RSI
- Gann
- ADXR
- Stochastics
- Volume
- Triangles
- Futures
- Cycles
- Volatility
- ZIGZAG
- MESA
- Retracement
- Aroon
INDICATORS LIST
LIST OF TOPICS
PRINT THIS ARTICLE
by Mark Rivest
A great opportunity to buy stocks could be just a few days away.
Position: N/A
Mark Rivest
Independent investment advisor, trader and writer. He has written articles for Technical Analysis of Stocks & Commodities, Traders.com Advantage,Futuresmag.com and, Finance Magnates. Author of website Four Dimension Trading.
PRINT THIS ARTICLE
ELLIOTT WAVE
One Path to Profits
12/30/15 04:36:34 PMby Mark Rivest
A great opportunity to buy stocks could be just a few days away.
Position: N/A
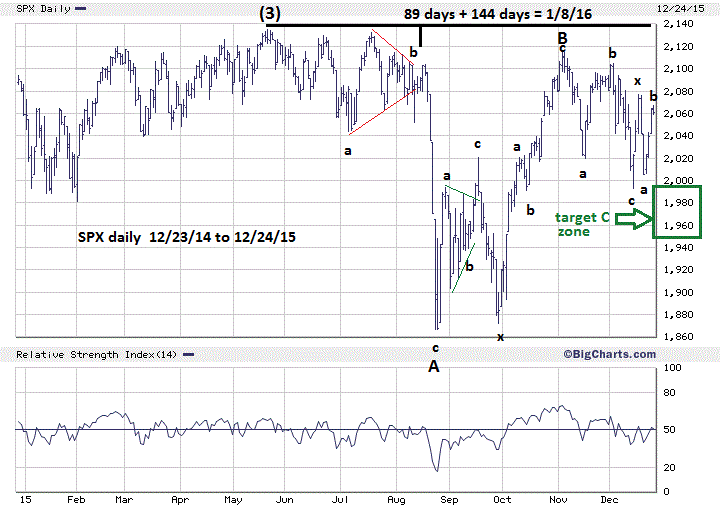
| Using the Elliott wave theory is a process of elimination, sorting through the various patterns to find the optimal trading opportunity. My December 8th article "Three Paths To Profits" illustrated the three paths stocks could take over the balance of December. My December 23rd article "Stock Market Ending The Year With A Bang?" narrowed the focus on two paths. The pre-Christmas rally December 21-24, has reduced the choice to one pattern with the highest probability of success. That pattern is a Horizontal Triangle. Price And Time At the close of stock trading on December 18th the bears had everything going for them. A sharp two-day decline came after the FOMC announcement and the daily Stochastic flashed a bearish cross over. Then a sharp reversal with a three-day rally into Christmas eve. This rally in itself is another clue of a multi month rally in development. The bears blew a chance to smash the market lower and couldn't follow through. My December 16th article "The Time Factor" focused on several time cycles pointing to a turn close to the end of 2015. There's one other time cycle indicating a possible turn just after the new year. May 20th to August 17 is 89 calendar days, which happens to be one of the numbers in the Fibonacci sequence. Adding the next number in the sequence 144 calendar days to August 17th targets Friday January 8, 2016. January 9th is a new moon. Please see the daily S&P 500 (SPX) chart in Figure 1. Also review the illustrated Elliott wave patterns in my November 30th article "Stock Market Building A Base" Figure 2. The entire Horizontal Triangle pattern in the SPX from May 20th could be complete as of December 18th with the December 14th bottom as the possible wave "C" of the triangle. This is a low probability count because the Dow Jones Industrial Average exceeded its December 14th bottom. Most likely, wave "C" of the Horizontal Triangle is forming a Double Zigzag from the November 3rd peak. If so, December 24 is probably wave "b" of the second Zigzag. Backing up this theory is the full moon on December 25th which was discussed in the December 16th article as a possible lunar cycle turn. A common price relationship within Double Zigzags is the first Zigzag equaling the second Zigzag. The November 3rd to December 14th Zigzag was 123.22 points. Subtracting this from the "x" wave peak of 2076.72 on December 18th targets 1953.50. Within Horizontal Triangles wave "C" usually has a relationship with wave "A". The May-August wave "A" was 267.71 points multiplied by .618 equals 165.44 points. Subtracting 165.44 from the "B" wave top of 2116.48 targets 1951.04. The "C" wave bottom bulls-eye target is SPX 1951.04-1953.50 |

|
| Figure 1. Wave "C" of the Horizontal Triangle maybe forming a Double Zigzag. |
| Graphic provided by: BigCharts.com. |
| |
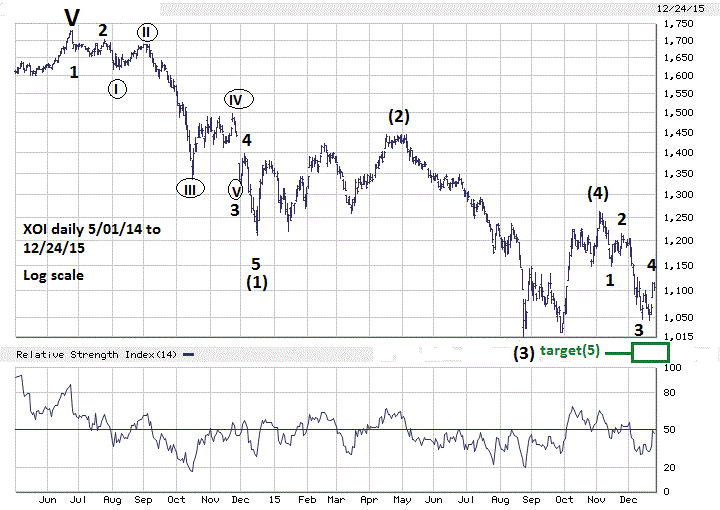
| NYSE ARCA Oil Index (XOI) Crude Oil and most stock indices bottomed on August 24th. Crude Oil may have made a lower, more significant bottom in December. If not, a bottom could be just days away. Please see the illustrated daily XOI chart in Figure 2. The XOI has an amazingly clear Elliott wave pattern with Fibonacci relationships among the sub waves. Waves (2) and (4) are nearly equal, wave (2) retraces close to .618 of wave (1) while wave (4) retraces close to .382 of wave (3). Note that wave (4) overlaps into the territory of wave (1). This five wave pattern is called a Leading Diagonal Triangle and implies that the entire structure from the June 2014 top is just the first phase down of a larger bear market that could last at least another two years. The supposed wave (5) appears to be close to completion. Wave (1) decline was 30%, a 30% decline from the wave (2) peak of 1444.82 targets 1011.38. Within wave (5) sub wave 1 = 116.04 points. If sub wave 4 peaked at 1115.42, minus 116.04 equals 999.38 as the target for wave 5 of (5). Also note sub wave 1 of (5) took eight trading days to complete. If wave 5 of (5) equals the time of wave 1, the time target for a significant XOI bottom would be January 7, 2016. The bulls-eye target zone for a significant XOI bottom is 999.38-1011.38 |

|
| Figure 2. XOI has an amazingly clear Elliott wave pattern. |
| Graphic provided by: BigCharts.com. |
| |
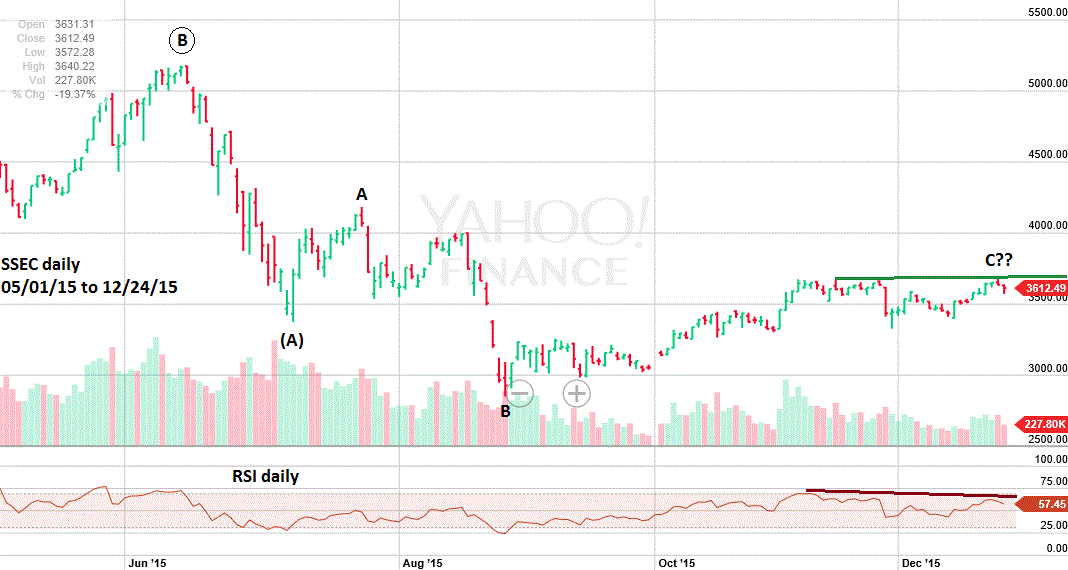
| Shanghai Composite (SSEC) Please see the illustrated SSEC daily chart in Figure 3. My December 16th article noted that the SSEC had completed a Horizontal Triangle starting from the early July bottom. Since then the SSEC has exceeded the supposed wave "E" and "C" peaks invalidating the completed Horizontal Triangle Pattern. I speculated that declining Crude Oil could trigger a sharp selloff in the Chinese stock indices which in turn could trigger another global mini crash. As of the close on December 24th the SSEC had a minor daily RSI bearish divergence implying a decline could come soon. However, it is doubtful there will be enough time for the SSEC to complete the Horizontal Triangle and move below the bottom at 2850 in the next nine trading days. The Chinese stock indices patterns from their 2015 tops still look incomplete to the downside, but it may take several weeks before the 2015 bottoms can be breached. |

|
| Figure 3. SSEC has a daily RSI bearish divergence implying a decline could come soon. |
| Graphic provided by: Yahoo! Finance. |
| |
| Strategy Keep the inverse fund stop loss level at the December 16th high. Exit half the inverse fund position if the SPX breaks below 1993.26 and lower the stop level on the remainder to the December 24th high. Exit the remainder if the SPX reaches 1960. Start to enter new long positions if the SPX breaks below 1993.26 — the optimal time would be December 30-31. If the SPX is trading in the area of 1948-1955 between January 6-8 get very aggressive with long side purchases and use a stop loss level 2% below SPX 1948. Victory or defeat in the markets can sometimes be determined by actions taken in the span of just a few days. The stock market may present a tremendous opportunity at the turn of the year. Be prepared to take advantage of that opportunity. Happy New Year to all! Further reading: Frost A.J and Robert Prechter (1985) "Elliott Wave Principle", New Classics Library. |
Independent investment advisor, trader and writer. He has written articles for Technical Analysis of Stocks & Commodities, Traders.com Advantage,Futuresmag.com and, Finance Magnates. Author of website Four Dimension Trading.
| Website: | www.fourdimensiontrading.com |
| E-mail address: | markrivest@gmail.com |
Click here for more information about our publications!
PRINT THIS ARTICLE

|

Request Information From Our Sponsors
- StockCharts.com, Inc.
- Candle Patterns
- Candlestick Charting Explained
- Intermarket Technical Analysis
- John Murphy on Chart Analysis
- John Murphy's Chart Pattern Recognition
- John Murphy's Market Message
- MurphyExplainsMarketAnalysis-Intermarket Analysis
- MurphyExplainsMarketAnalysis-Visual Analysis
- StockCharts.com
- Technical Analysis of the Financial Markets
- The Visual Investor
- VectorVest, Inc.
- Executive Premier Workshop
- One-Day Options Course
- OptionsPro
- Retirement Income Workshop
- Sure-Fire Trading Systems (VectorVest, Inc.)
- Trading as a Business Workshop
- VectorVest 7 EOD
- VectorVest 7 RealTime/IntraDay
- VectorVest AutoTester
- VectorVest Educational Services
- VectorVest OnLine
- VectorVest Options Analyzer
- VectorVest ProGraphics v6.0
- VectorVest ProTrader 7
- VectorVest RealTime Derby Tool
- VectorVest Simulator
- VectorVest Variator
- VectorVest Watchdog
