HOT TOPICS LIST
- MACD
- Fibonacci
- RSI
- Gann
- ADXR
- Stochastics
- Volume
- Triangles
- Futures
- Cycles
- Volatility
- ZIGZAG
- MESA
- Retracement
- Aroon
INDICATORS LIST
LIST OF TOPICS
PRINT THIS ARTICLE
by Mark Rivest
How to take advantage of a late year stock market decline.
Position: N/A
Mark Rivest
Independent investment advisor, trader and writer. He has written articles for Technical Analysis of Stocks & Commodities, Traders.com Advantage,Futuresmag.com and, Finance Magnates. Author of website Four Dimension Trading.
PRINT THIS ARTICLE
ELLIOTT WAVE
Stock Market Ending the Year with a Bang?
12/23/15 01:36:07 PMby Mark Rivest
How to take advantage of a late year stock market decline.
Position: N/A
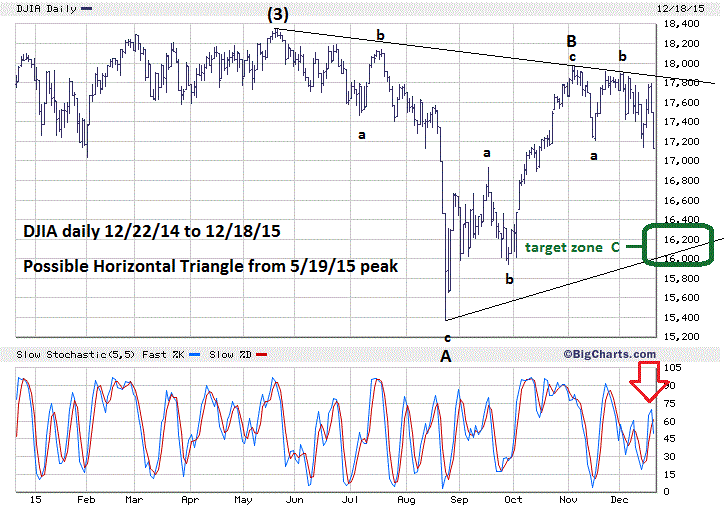
| The stock market is usually boring in the last two weeks of the year, with not much movement up or down. Late 2015 could be the exception. Time cycles have been hinting of a late year turn and now momentum indicators are turning down. An examination of four important indices point to what could be a very important bottom for stocks. Dow Jones Industrial Average (DJIA) My December 8th article "Three Paths to Profits" illustrated three Elliott wave patterns stocks could take going into the end of 2015. Currently the Horizontal Triangle and the Double Zigzag patterns are the most likely paths under construction. Both counts could come to completion in two different indices' because the DJIA is declining less than the S&P 500 (SPX). Please see the illustrated DJIA daily chart in Figure 1. The SPX decline since November 3rd decline has so far been able to retrace 49% of its August-November rally, the DJIA has only retraced 32% of that same rally. If the DJIA fails to break below its August bottom a bullish divergence could develop with the SPX. In this case the DJIA best count for a late 2015 bottom would be wave "C" of a still developing Horizontal Triangle. My December 16th article "The Time Factor" noted that US stocks throughout most of 2015 traveled in the same direction after an FOMC announcement as they have been traveling before the announcement. In December stocks did something different, first declining, then rallying for two days into the announcement with the decline resuming the following day. This erratic behavior appears to only be a pause in the decline that began on November 3rd. Even after a post FOMC decline of 672 DJIA points, the daily slow Stochastic has flashed a bearish crossover signal. This indicates a high probability the DJIA could reach an area of chart support and a .618 retrace of the August-November rally before the end of 2015. |

|
| Figure 1. DJIA Daily. Stochastic bearish crossover signals more decline to come. |
| Graphic provided by: BigCharts.com. |
| |
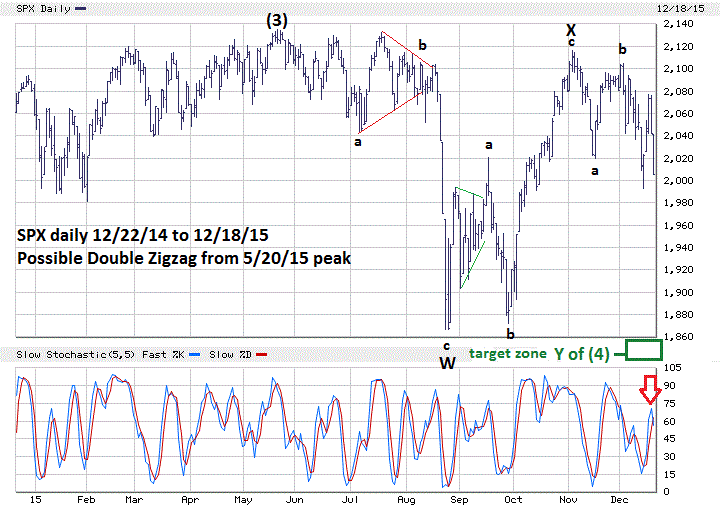
| Standard & Poor's 500 (SPX) My December 8th article Figure 2 illustrated that the SPX could put in a bottom in the area of 1990. The low on December 14th was 1993.26, while as of December 18th the SPX has still not taken out this low there is a very good chance it will very soon. The SPX, like the DJIA, has a bearish crossover on the daily Stochastic. Additionally, the SPX advance/decline line on December 18th has gone below the reading made on December 14th. Please see the daily SPX chart illustrated in Figure 2. Fibonacci points are like magnets to a market, the more points and their size determine the power of the magnets. There are two major Fibonacci points just below the SPX August 24th bottom at 1867.01. The first is the relationship with the SPX correction in 2011 which was 21.5%, multiplied by .618 equals 13.28%. The SPX 2015 high is 2134.72, a 13.28% decline from this level target SPX 1851.23. The second point comes from the SPX May-August decline which was 267.71 points. The November 3rd top, labeled as wave "X "is 2116.48, subtract 267.71 from this top targets 1848.77. The difference between the two coordinates is only 2.46 SPX points making this a very powerful magnet that the SPX could be drawn to in the last week of 2015. |

|
| Figure 2. SPX Daily. Fibonacci points at 1848 and 1851 could provide strong support. |
| Graphic provided by: BigCharts.com. |
| |
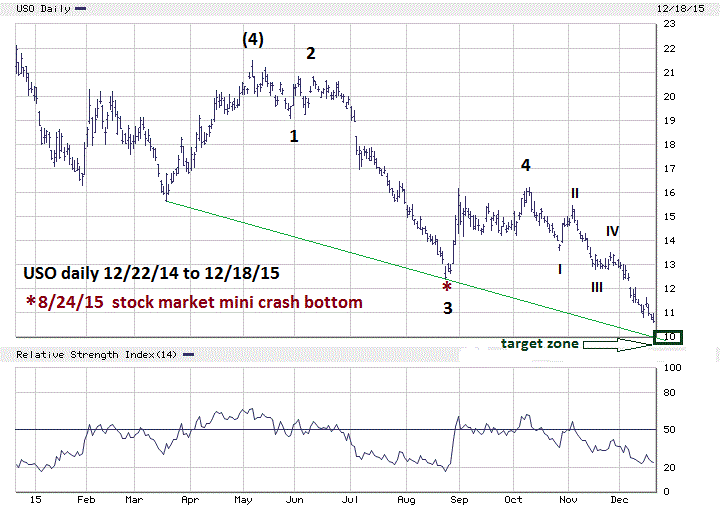
| United States Oil (USO) $20 Oil, $20 Oil, $20 Oil. This is the chant since Crude Oil broke below its August 24th 2015 low at about $40 a barrel. The last significant peak in Crude Oil was June 2014. Since then Crude Oil has declined more than 70%. Now we get the predictions of a 50% decline! It's a safe bet there were probably very few predictions of a major decline in June 2014. A significant bottom in Crude Oil could be coming very soon, and it's more likely to be closer to $30 then $20. Please see the daily chart of the ETF-USO in Figure 3. USO is the ETF that tracks Crude Oil and appears to be nearing completion of an Elliott five wave pattern from the April 2012 peak. There is trendline support near 10 and also two short term Fibonacci points at 10.01 and 10.11. The weekly RSI (not shown) hit its low at 9% in January 2015. The most current reading at a lower price is 24%, a significant bullish divergence. Energy sector ETF (XLE) on August 24th made its 2015 low of 58.74. On December 18th, with Crude Oil below its August 24th low, the XLE low was 58.77, just above the August low. Among the top ten stocks within XLE, eight made 2015 lows on August 24th. On December 18th, only two were making new 2015 lows. The developing strength in the XLE is another hint that Crude Oil is nearing a significant bottom. |

|
| Figure 3. USO Daily. USO could be nearing a significant bottom. |
| Graphic provided by: BigCharts.com. |
| |
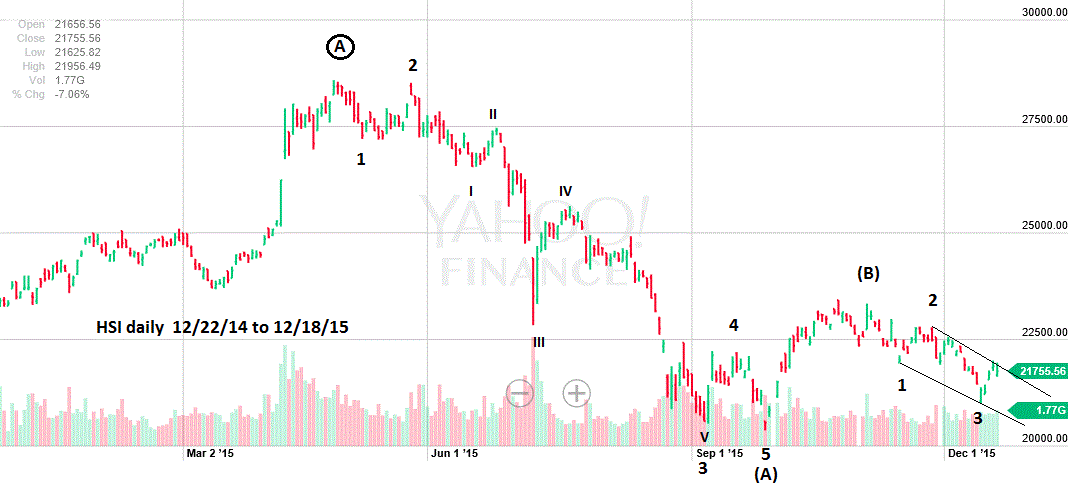
| Hang Seng index (HSI) The decline of Crude Oil is important because it reflects potential industrial weakness and the Chinese stock indices have been the most sensitive to falling Crude Oil. Please see the illustrated HSI daily chart in Figure 4. My December 16th article illustrated the progress of the Shanghai Composite (SSEC). The Hang Seng index is the focus of this article because it is closer to making a new 2015 low than the SSEC. The HSI is only 7% above its 2015 bottom. If the HSI can make a new low, it would probably be followed by the SSEC, which in turn could lead to a global stock market decline. |

|
| Figure 4. HSI Daily. The HSI is only 7% above its 2015 bottom. |
| Graphic provided by: Yahoo! Finance. |
| |
| Strategy My December 8th article recommended hedging long stock positions with non-leveraged inverse stock funds. Continue holding these funds unless the December 16th high is exceeded. Otherwise stagger exits out of the inverse funds at SPX 1950 and lower. Concentrate stock purchases to only large caps that are out-performing the main US stock indices. Purchases of sector ETF's should be limited to; XLY-Consumer discretionary, XLK-Technology, and XLP-Consumer staples. If a late year bottom does develop, these purchases could be the seeds to making 2016 a happy new year! Further reading: Frost A.J and Robert Prechter (1985) "Elliott Wave Principle", New Classics Library. |
Independent investment advisor, trader and writer. He has written articles for Technical Analysis of Stocks & Commodities, Traders.com Advantage,Futuresmag.com and, Finance Magnates. Author of website Four Dimension Trading.
| Website: | www.fourdimensiontrading.com |
| E-mail address: | markrivest@gmail.com |
Click here for more information about our publications!
Comments
Date: 12/25/15Rank: 5Comment:

Request Information From Our Sponsors
- VectorVest, Inc.
- Executive Premier Workshop
- One-Day Options Course
- OptionsPro
- Retirement Income Workshop
- Sure-Fire Trading Systems (VectorVest, Inc.)
- Trading as a Business Workshop
- VectorVest 7 EOD
- VectorVest 7 RealTime/IntraDay
- VectorVest AutoTester
- VectorVest Educational Services
- VectorVest OnLine
- VectorVest Options Analyzer
- VectorVest ProGraphics v6.0
- VectorVest ProTrader 7
- VectorVest RealTime Derby Tool
- VectorVest Simulator
- VectorVest Variator
- VectorVest Watchdog
- StockCharts.com, Inc.
- Candle Patterns
- Candlestick Charting Explained
- Intermarket Technical Analysis
- John Murphy on Chart Analysis
- John Murphy's Chart Pattern Recognition
- John Murphy's Market Message
- MurphyExplainsMarketAnalysis-Intermarket Analysis
- MurphyExplainsMarketAnalysis-Visual Analysis
- StockCharts.com
- Technical Analysis of the Financial Markets
- The Visual Investor
