

HOT TOPICS LIST
- MACD
- Fibonacci
- RSI
- Gann
- ADXR
- Stochastics
- Volume
- Triangles
- Futures
- Cycles
- Volatility
- ZIGZAG
- MESA
- Retracement
- Aroon
INDICATORS LIST
LIST OF TOPICS
PRINT THIS ARTICLE
by Mark Rivest
The S&P 500 and Shanghai Composite could soon give signals for an important bottom.
Position: N/A
Mark Rivest
Independent investment advisor, trader and writer. He has written articles for Technical Analysis of Stocks & Commodities, Traders.com Advantage,Futuresmag.com and, Finance Magnates. Author of website Four Dimension Trading.
PRINT THIS ARTICLE
FIBONACCI
Buy In May And Stay
05/09/16 05:16:30 PMby Mark Rivest
The S&P 500 and Shanghai Composite could soon give signals for an important bottom.
Position: N/A
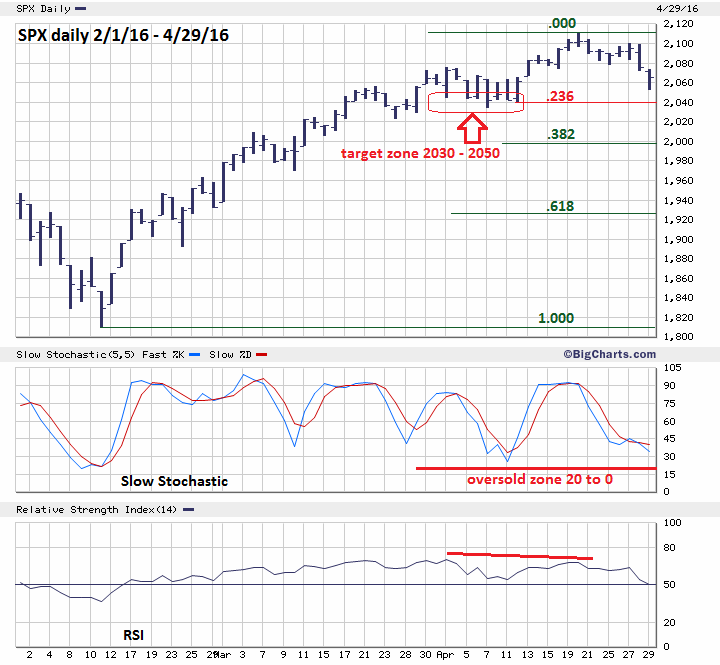
| Early May could be a great time to buy stocks. The S&P 500 (SPX) is nearing a strong support zone, while the Shanghai Composite appears to be completing a bullish price pattern. If both indices can reach, and hold, important support levels, the subsequent rally could continue into August. S&P 500 Analysis of the price dimension for any market begins by first focusing on a segment then determining support and resistance levels within that segment. Please see the daily SPX chart illustrated in Figure 1. In this particular case, the market segment is the SPX rally from 1810, on February 11th, to the peak made on April 20th at 2111. In my April 27th article "Shanghai Surprise" I noted that the Dow Jones Industrial Average's recent rally high was accompanied by a bearish divergence on the daily RSI. This bearish divergence also occurred on the SPX and turned out to be a signal for the largest correction since the rally began on February 11th. Shown on the daily SPX chart are the Fibonacci support levels, the first one is a .236 retrace at SPX 2040.03, which is very near the low made on April 11th at 2041.88. The April 11th bottom represents the second Fibonacci coordinate ratio of 1/1, the decline from the peak made on April 20th would equal the rally from April 11th - April 20th. There is also a third Fibonacci coordinate. The small decline from April 20th to April 25th was 33.53 points, the subsequent rally from April 25th came very close to a .618 retrace of the 33.53-point decline and peaked at SPX 2099.87. Multiply 33.53 by 1.618 and it equals 54.25. Subtract 54.25 from 2099.87 and it targets 2045.64, which is very close to the two other Fibonacci coordinates. There is additional chart support at SPX 2033.80, the April 7th bottom. Allowing for leeway the broader support zone is 2030-2050. Additional evidence the SPX could reach the zone comes from the daily Slow Stochastic which has yet to reach its oversold area of 20 to 0. Triple Fibonacci points imply powerful support and it would require a powerful decline to break through. If a breakthrough were to occur, it is most likely that the SPX could quickly travel past the .382 retracement level and find support at 1925.07 which is a .618 retrace of the February - April rally. |
|
| Figure 1. The SPX could reach the 2030-2050 support zone as soon as May 3rd. |
| Graphic provided by: BigCharts.com. |
| |
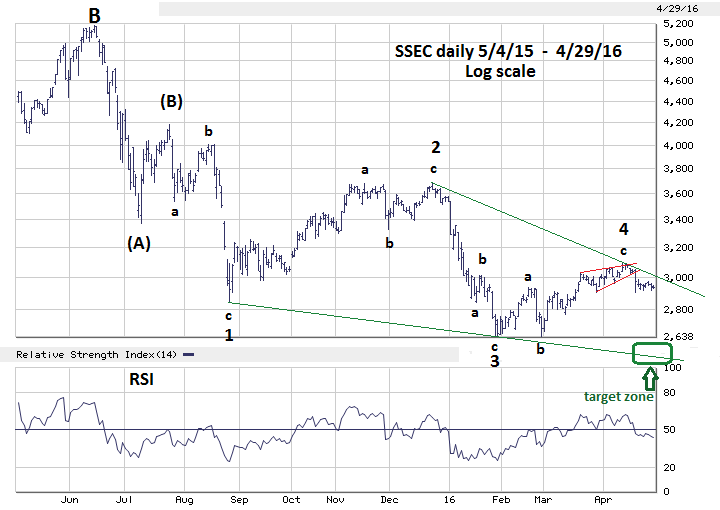
| Shanghai Composite Update Please see the daily Shanghai Composite (SSEC) chart illustrated in Figure 2. This chart shows the SSEC forming what appears to be an Ending Diagonal Triangle (EDT) from the July 2015 intermediate peak. Not much has changed since my April 27th article discussed the EDT pattern as the SSEC has stalled in the 2900 area. I had expected the EDT could be completed in the May 2-5 time zone. This now appears unlikely. This forecast was made by multiplying the number of calendar days, 33, of the supposed EDT wave "1" by .618. This yielded 20 calendar days added to the supposed wave "4" end on April 13th. The fifth wave of an EDT should be the shortest in terms of time. Therefore, the longest wave "5" of the EDT should be is 32 calendar days. If the SSEC is still making new lows more than 32 calendar days after April 13th it would put the EDT wave count in doubt. May 15th is the maximum time target. The broader price zone for end of the EDT remains 2440-2540. Based on where the SSEC closed on April 29th, May 9-11 could be a likely time zone. |
|
| Figure 2. SSEC support is 2440-2540. |
| Graphic provided by: BigCharts.com. |
| |
| Conclusion If the SPX were to decline into and bottom in the 2030-2050 support zone, could the next rally lead into a major peak later in May? Yes, given that the month of May has been prominent in significant stock market peaks in recent years. What's different in 2016 is the price structure of the SSEC. If an EDT pattern on the SSEC can complete in the first or second week of May, the subsequent rally could last for two-four months. Since mid-2015, the SSEC has been one of the weakest stock indexes in the world. If it has a multi-month rally most stock markets around the world could follow in its wake. My April 13th article, "Battle Of Bulls Vs. Bears", recommended getting defensive on stock positions if a correction lasted longer than five trading days. This has occurred and the main US stock indices, as of the close of April 29th, appear to still be in correction mode. Aggressive traders could resume buying stocks if the SPX reaches the 2030-2050 support zone, use a break below SPX 2030 as a defensive signal. A more cautious strategy would be to wait for the SSEC to reach its support zone of 2440-2550. Since mid-2015 the SSEC has been bottoming a few days after the SPX. This pattern is likely to continue if an important stock bottom is made in early May. Going into May the SSEC is the most important stock index to watch. The complexities of EDTs make them excellent structures to forecast market turns. The supposed SSEC EDT is more than nine months old, which is rare for this type of structure. If the SSEC can reach 2440-2550 in the first half of May and the SPX can hold above 2030 it could be a terrific time to enter long stock positions. Further Reading: Frost A.J and Robert Prechter (1985) "Elliott Wave Principle", New Classics Library. |
Independent investment advisor, trader and writer. He has written articles for Technical Analysis of Stocks & Commodities, Traders.com Advantage,Futuresmag.com and, Finance Magnates. Author of website Four Dimension Trading.
| Website: | www.fourdimensiontrading.com |
| E-mail address: | markrivest@gmail.com |
Click here for more information about our publications!
Comments

Request Information From Our Sponsors
- StockCharts.com, Inc.
- Candle Patterns
- Candlestick Charting Explained
- Intermarket Technical Analysis
- John Murphy on Chart Analysis
- John Murphy's Chart Pattern Recognition
- John Murphy's Market Message
- MurphyExplainsMarketAnalysis-Intermarket Analysis
- MurphyExplainsMarketAnalysis-Visual Analysis
- StockCharts.com
- Technical Analysis of the Financial Markets
- The Visual Investor
- VectorVest, Inc.
- Executive Premier Workshop
- One-Day Options Course
- OptionsPro
- Retirement Income Workshop
- Sure-Fire Trading Systems (VectorVest, Inc.)
- Trading as a Business Workshop
- VectorVest 7 EOD
- VectorVest 7 RealTime/IntraDay
- VectorVest AutoTester
- VectorVest Educational Services
- VectorVest OnLine
- VectorVest Options Analyzer
- VectorVest ProGraphics v6.0
- VectorVest ProTrader 7
- VectorVest RealTime Derby Tool
- VectorVest Simulator
- VectorVest Variator
- VectorVest Watchdog