

HOT TOPICS LIST
- MACD
- Fibonacci
- RSI
- Gann
- ADXR
- Stochastics
- Volume
- Triangles
- Futures
- Cycles
- Volatility
- ZIGZAG
- MESA
- Retracement
- Aroon
INDICATORS LIST
LIST OF TOPICS
PRINT THIS ARTICLE
by Mark Rivest
Evidences continues to indicate US stocks are near an intermediate top. Fibonacci analysis could hold the answer of where a down turn could begin.
Position: N/A
Mark Rivest
Independent investment advisor, trader and writer. He has written articles for Technical Analysis of Stocks & Commodities, Traders.com Advantage,Futuresmag.com and, Finance Magnates. Author of website Four Dimension Trading.
PRINT THIS ARTICLE
SUPPORT & RESISTANCE
S&P 500 Near A Ceiling
08/17/16 04:19:52 PMby Mark Rivest
Evidences continues to indicate US stocks are near an intermediate top. Fibonacci analysis could hold the answer of where a down turn could begin.
Position: N/A
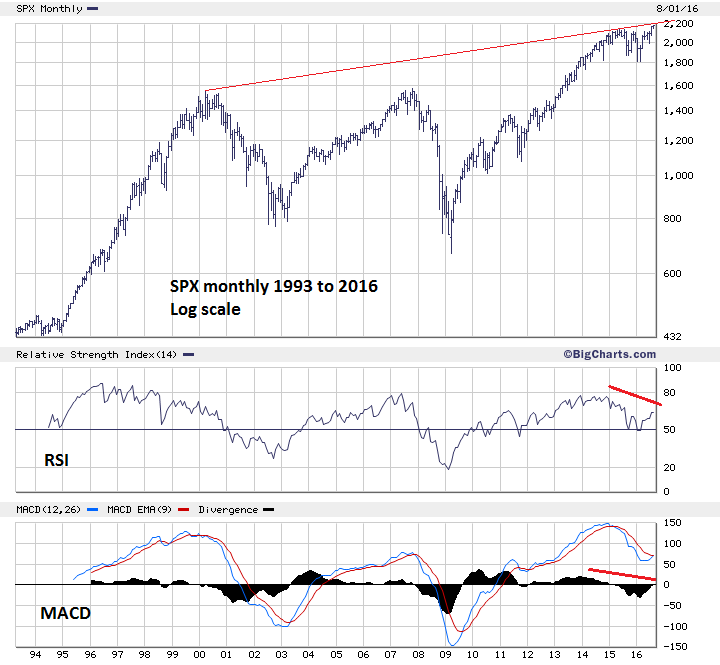
| Since the July 20th top the S&P 500 (SPX) has struggled to move up, gaining only nine points in twelve trading days. The Dow Jones Industrial Average (DJIA) has also lagged. Only the NASDAQ composite (COMP) been able to have a significant rally. Fibonacci analysis of these three indices may hold the clue to where an intermediate decline could begin. S&P 500 Monthly Please see the monthly SPX chart illustrated in Figure 1. My last article "How to Trade Defensively - Part Two" noted a very important Fibonacci resistance level at SPX 2183.53. The SPX high on August 5th was 2182.87, less than one point away. It's possible a bullseye-hit of the target could have been made on August 5th. However, whenever using Fibonacci analysis we need to allow for leeway above and below the exact level. In this situation, leeway for a peak could go to perhaps 2193 — determining leeway is not an exact science. Additional evidence that the SPX could rally a little further comes from the long term monthly SPX trendline from the major peak made in the year 2000. Note that the line currently crosses near SPX 2200. Monthly moment indicators are a mixed picture. The RSI and MACD histogram have bearish divergences. However, the MACD line is on the verge of a bullish crossover. |
|
| Figure 1. S&P 500 Monthly Chart. Note that the line currently crosses near SPX 2200. |
| Graphic provided by: BigCharts.com. |
| |
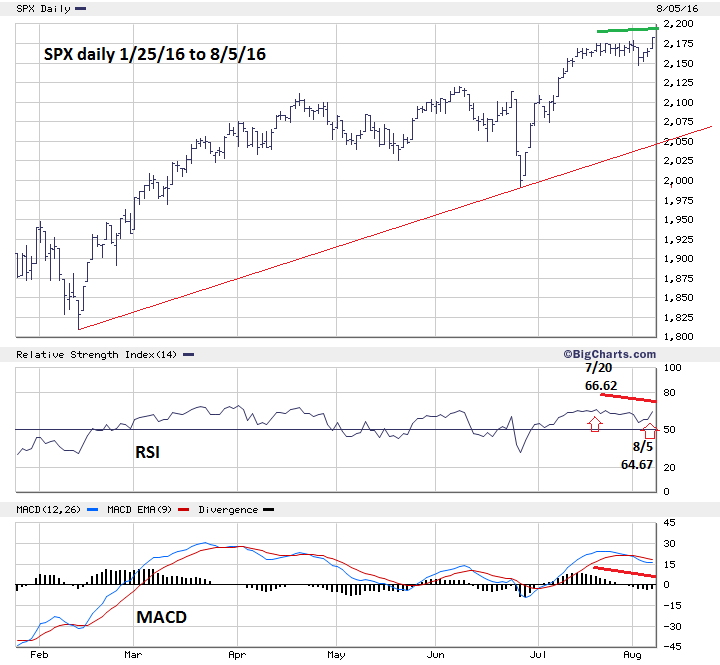
| S&P 500 Daily Please see the daily SPX chart illustrated in Figure 2. As of August 5th, the daily SPX-RSI had a marginal bearish divergence, however the daily MACD is similar to the monthly MACD showing a histogram bearish divergence and the possibility the line could have a bullish crossover. My July 21st article "How to Trade Defensively" noted that SPX 2120 could be a downside target if an Elliott wave Ending Diagonal Triangle is under construction. If so, 2120 to 2100 would be the ideal target support zone. What if the SPX begins a decline and it's not just the beginning of intermediate correction but a more significant drop? An important clue of a larger bear move could come from a significant breach below the trendline connecting the bottoms made on February 11th and June 27th. If the SPX is below 2100 and trades two consecutive days below the trendline it could be our most important indication that a major move down is underway. |
|
| Figure 2. S&P 500 Daily Chart. If the SPX is below 2100 and trades two consecutive days below the trendline it could be our most important indication that a major move down is underway. |
| Graphic provided by: BigCharts.com. |
| |
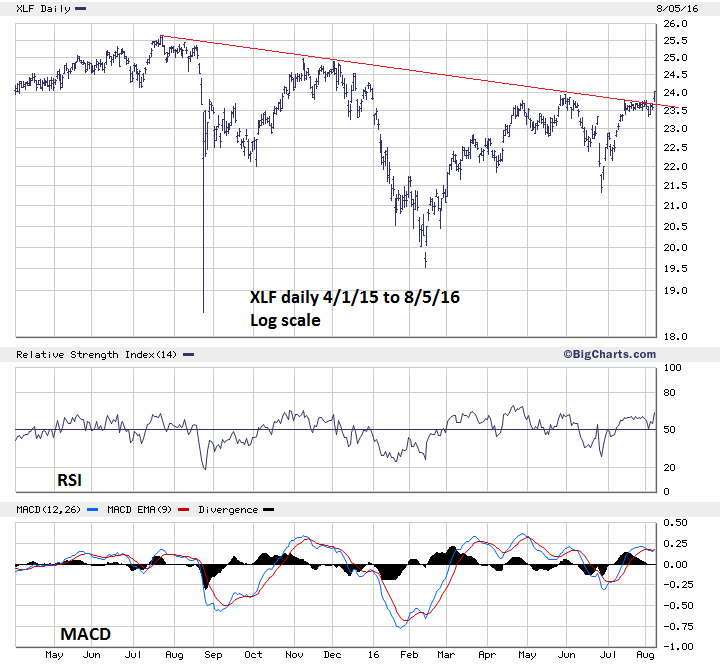
| Financial Select Sector SPDR Fund (XLF) Please see the daily XLF chart illustrated in Figure 3. Since mid-2015 the financial sector has been significantly lagging the SPX. My August 3rd article noted that the XLF moving above its May 31st high at 23.93 would be a major clue that the bulls are in control. On August 5th the XLF moved above this high, and the declining trendline that has been in effect since the major peak made in July 2015. Additionally, the daily RSI moved above the level it reached on May 25th. The daily MACD line has a bullish crossover, so near term there are no signs of weakening momentum. The data from the XLF is on the bullish side of the ledger. If this ETF continues to have a significant rally it could extend the rally in the broader stock indices. |
|
| Figure 3. XLF Daily Chart. The data from the XLF is on the bullish side of the ledger. |
| Graphic provided by: BigCharts.com. |
| |
| Summary And Strategy With mixed signals from the momentum indicators, we need to focus on the clearest evidence — Fibonacci price resistance levels. The SPX has reached a Fibonacci resistance bulls-eye at 2182. If the SPX is to move higher into its leeway zone, the DJIA, which closed August 5th at 18543, would probably move closer to its equivalent to SPX Fibonacci resistance at 18742. More importantly, the current leader COMP, which closed August 5th at 5221, may reach its 2015 high of 5231. This would be the Fibonacci ratio of 1/1 equality, where the 2016 rally equals the 2015/2016 bear market. If a stock market top is not in place as of August 5th watch the COMP. If it gets within a few points of 5231 anytime August 8-12, there is a high probability this could be an intermediate peak. With all three main US stock indices close to important Fibonacci resistance this is not the time to enter new long stock positions. Hold and maintain a stop loss for half of long positions at SPX 2120. Traders can initiate small short positions with a stop at SPX 2210. Further Reading: Frost A.J and Robert Prechter (1985) "Elliott Wave Principle", New Classics Library. |
Independent investment advisor, trader and writer. He has written articles for Technical Analysis of Stocks & Commodities, Traders.com Advantage,Futuresmag.com and, Finance Magnates. Author of website Four Dimension Trading.
| Website: | www.fourdimensiontrading.com |
| E-mail address: | markrivest@gmail.com |
Click here for more information about our publications!
PRINT THIS ARTICLE

Request Information From Our Sponsors
- StockCharts.com, Inc.
- Candle Patterns
- Candlestick Charting Explained
- Intermarket Technical Analysis
- John Murphy on Chart Analysis
- John Murphy's Chart Pattern Recognition
- John Murphy's Market Message
- MurphyExplainsMarketAnalysis-Intermarket Analysis
- MurphyExplainsMarketAnalysis-Visual Analysis
- StockCharts.com
- Technical Analysis of the Financial Markets
- The Visual Investor
- VectorVest, Inc.
- Executive Premier Workshop
- One-Day Options Course
- OptionsPro
- Retirement Income Workshop
- Sure-Fire Trading Systems (VectorVest, Inc.)
- Trading as a Business Workshop
- VectorVest 7 EOD
- VectorVest 7 RealTime/IntraDay
- VectorVest AutoTester
- VectorVest Educational Services
- VectorVest OnLine
- VectorVest Options Analyzer
- VectorVest ProGraphics v6.0
- VectorVest ProTrader 7
- VectorVest RealTime Derby Tool
- VectorVest Simulator
- VectorVest Variator
- VectorVest Watchdog