HOT TOPICS LIST
- MACD
- Fibonacci
- RSI
- Gann
- ADXR
- Stochastics
- Volume
- Triangles
- Futures
- Cycles
- Volatility
- ZIGZAG
- MESA
- Retracement
- Aroon
INDICATORS LIST
LIST OF TOPICS
PRINT THIS ARTICLE
by Mark Rivest
Utilizing an Elliott wave pattern to anticipate a trend change.
Position: N/A
Mark Rivest
Independent investment advisor, trader and writer. He has written articles for Technical Analysis of Stocks & Commodities, Traders.com Advantage,Futuresmag.com and, Finance Magnates. Author of website Four Dimension Trading.
PRINT THIS ARTICLE
ELLIOTT WAVE
How to Trade Defensively
07/21/16 03:17:14 PMby Mark Rivest
Utilizing an Elliott wave pattern to anticipate a trend change.
Position: N/A
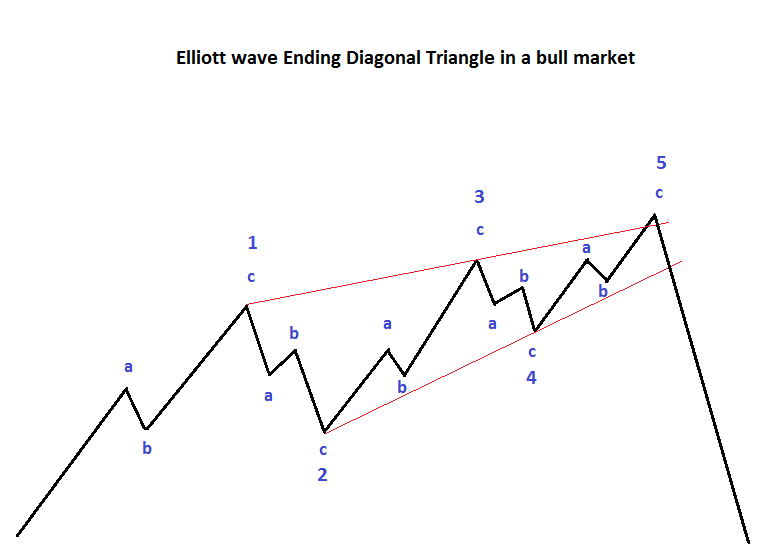
| When using Technical analysis to track any market, the only thing certain is that there will always be uncertainty. No matter which methodology you're using there is never a 100% chance of being correct. We weigh the evidence from our indicators and make decisions based on the highest probability. After the trade has been initiated we still need to be aware of low probability scenarios — low probability does not mean no probability. We always need to be on guard that even a very low probability scenario could result in losses. In my last article "Stocks - Up, Up, and Away!" I illustrated two paths the S&P 500 (SPX) could take. A high probability scenario in which over the period of several weeks the SPX could reach 2400. The lower probable scenario implied the SPX reaching only the 2200 area. This article will focus on the lower probable scenario and how an Elliott wave Ending Diagonal Triangle pattern could give us an early warning to a possible large move down for US stocks. Elliott Wave - Ending Diagonal Triangle Ending Diagonal Triangles (EDT) are a termination pattern that appear in either the "fifth" wave of an impulsive move or in wave "C" of a corrective move. Please see the Ending Diagonal Triangle pattern illustrated in Figure 1. An EDT takes a wedge shape and each of the sub waves, including waves "1", "3" and "5", subdivides into a three wave pattern. In almost all situations, wave "4" of an EDT will overlap into the territory of wave "1". Typically, wave "5" of an EDT will end in a throw-over, which is a brief break of the trend line connecting the end points of waves "1" and "3". After completion of an EDT pattern the subsequent reversal is swift and usually ends at, or near, the EDT point of origin. |

|
| Figure 1. Ending Diagonal Triangle is a termination pattern. |
| Graphic provided by: Mark Rivest. |
| |
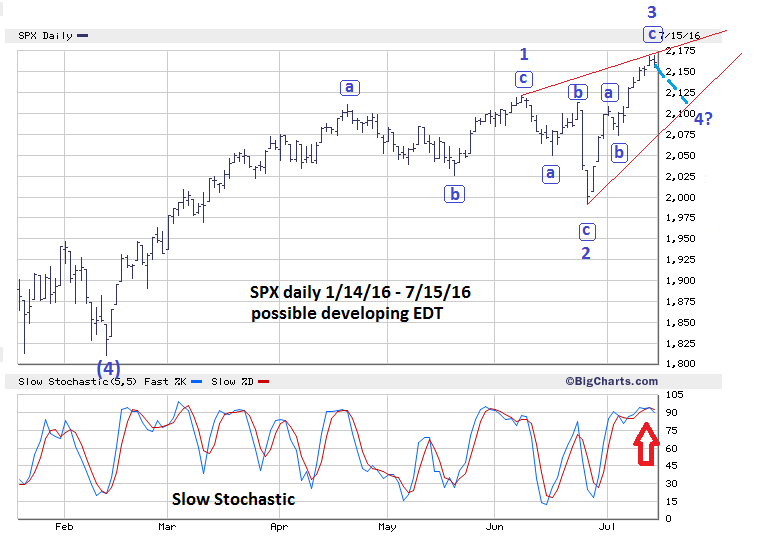
| S&P 500 From The February 2016 Bottom Please see the SPX daily chart illustrated in Figure 2. From the SPX bottom on February 11th it is now possible to count the first three wave of a developing Ending Diagonal Triangle as complete. If wave "3" of the EDT terminated at the intra-day high on July 15th, then a wave "4" decline could be underway. If so, SPX 2120.55 becomes very important. In an EDT, wave "4" of the structure almost always overlaps the territory of wave "1". The supposed peak of the SPX-EDT wave "1" is 2120.55. If the SPX were to decline below that level it would be an overlap of wave "1" and another clue that an EDT could be under construction. In my article "The Brexit Factor - Part Two" I noted the SPX was moving in time segments related to the Fibonacci sequence. The most recent example was adding 13 trading days to the June 8th peak which targeted the June 27th bottom. I wrote we may be able catch the next SPX peak using this method. Adding 13 trading days to June 27th bottom targets July 15. If the SPX has peaked on July 15th, adding 8 trading days (8 being the Fibonacci sequence number preceding 13) targets July 27th as a possible wave "4" bottom. Also note on the daily SPX chart that on July 15th the Slow Stochastic had a bearish crossover in over bought territory. |

|
| Figure 2. SPX 2120.55 is very important support. |
| Graphic provided by: BigCharts.com. |
| |
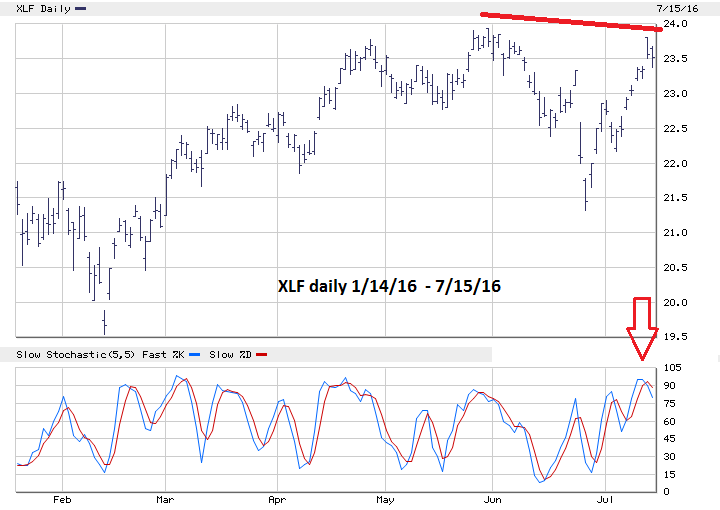
| Financial Select Sector SPDR Fund (XLF) There are many ways to measure momentum in the broader US stock market. One method is to examine the nine main sector ETFs and compare them to the SPX. Please see the daily XLF chart illustrated in Figure 3. The XLF relative to the SPX is very weak. Not only was the XLF unable to exceed its late May 2016 peak, but this late May top was significantly below its late 2015 peak. The SPX June 8th top was above its late 2015 high. The XLF from its 2015 high could be forming an Elliott wave series of ones and twos to the downside. This is a very bearish formation, and if in effect, implies there could be a very sharp and powerful move down within the next few weeks. The financial sector is currently the most important to monitor. |

|
| Figure 3. The financial sector is currently the most important to monitor. |
| Graphic provided by: BigCharts.com. |
| |
| Strategy Raise the stop loss for half of all long positions to SPX 2120.55 and maintain the stop loss on half of long positions at SPX 1991.68. Good traders have mental flexibility, are not married to a position and, if needed, can change their opinion in an instant. Before the end of July we may get very important signals regarding the direction of US stocks. Be prepared to take action if the SPX breeches 2120.55. It could determine whether you have a profit or a loss for 2016. Further Reading: Frost A.J and Robert Prechter (1985) "Elliott Wave Principle", New Classics Library. |
Independent investment advisor, trader and writer. He has written articles for Technical Analysis of Stocks & Commodities, Traders.com Advantage,Futuresmag.com and, Finance Magnates. Author of website Four Dimension Trading.
| Website: | www.fourdimensiontrading.com |
| E-mail address: | markrivest@gmail.com |
Click here for more information about our publications!
Comments
Date: 08/11/16Rank: 1Comment: your prediction is wrong. How could you be that.
It is waste of time to read you.

Request Information From Our Sponsors
- StockCharts.com, Inc.
- Candle Patterns
- Candlestick Charting Explained
- Intermarket Technical Analysis
- John Murphy on Chart Analysis
- John Murphy's Chart Pattern Recognition
- John Murphy's Market Message
- MurphyExplainsMarketAnalysis-Intermarket Analysis
- MurphyExplainsMarketAnalysis-Visual Analysis
- StockCharts.com
- Technical Analysis of the Financial Markets
- The Visual Investor
- VectorVest, Inc.
- Executive Premier Workshop
- One-Day Options Course
- OptionsPro
- Retirement Income Workshop
- Sure-Fire Trading Systems (VectorVest, Inc.)
- Trading as a Business Workshop
- VectorVest 7 EOD
- VectorVest 7 RealTime/IntraDay
- VectorVest AutoTester
- VectorVest Educational Services
- VectorVest OnLine
- VectorVest Options Analyzer
- VectorVest ProGraphics v6.0
- VectorVest ProTrader 7
- VectorVest RealTime Derby Tool
- VectorVest Simulator
- VectorVest Variator
- VectorVest Watchdog
