

HOT TOPICS LIST
- MACD
- Fibonacci
- RSI
- Gann
- ADXR
- Stochastics
- Volume
- Triangles
- Futures
- Cycles
- Volatility
- ZIGZAG
- MESA
- Retracement
- Aroon
INDICATORS LIST
LIST OF TOPICS
PRINT THIS ARTICLE
by Mark Rivest
US stock indices appear to have begun a new up leg. How much higher could they go? Elliott wave analysis may have the answer.
Position: N/A
Mark Rivest
Independent investment advisor, trader and writer. He has written articles for Technical Analysis of Stocks & Commodities, Traders.com Advantage,Futuresmag.com and, Finance Magnates. Author of website Four Dimension Trading.
PRINT THIS ARTICLE
ELLIOTT WAVE
Stocks - Up, Up and Away!
07/20/16 04:03:12 PMby Mark Rivest
US stock indices appear to have begun a new up leg. How much higher could they go? Elliott wave analysis may have the answer.
Position: N/A
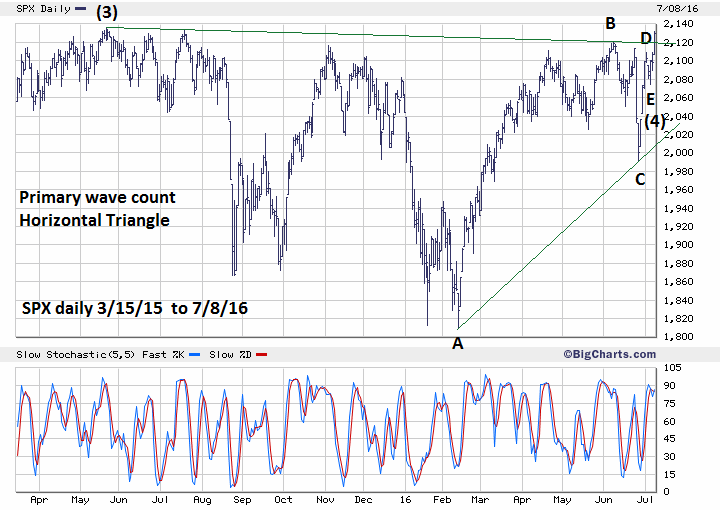
| On July 8, 2016 the S&P 500 (SPX) blasted up 32 points — 1.53% hitting an intraday high of 2131.71 which is just below the high made on July 20, 2015 at 2132.22 and the all-time high made on May 20, 2015 at 2134.72. The May and July tops are very important Fibonacci resistance. The May top is particularly important as it's connected to a Fibonacci coordinate that goes all the way back to 2007. Please see my June 8, 2015 article "The Golden Section". If the SPX were to push above 2134.72, it could signal significantly higher prices in the next several weeks. Elliott wave analysis has clues as to levels the SPX could reach in the coming weeks. S&P 500 - Primary Wave Count Please see the daily SPX chart primary wave count illustrated in Figure 1. Elliott wave Horizontal Triangles are corrective patterns that appear in the fourth wave of a five wave impulse and in wave "B" of corrective patterns. Horizontal Triangles have five sub-waves each of which subdivide into three wave patterns. The entire pattern completes with the termination of wave "E", the subsequent reversal is referred to as a post triangle thrust, a swift and powerful move. The length of the post triangle thrust is approximately the widest part of the triangle. In the case of the supposed May 20, 2015 - July 6, 2016 triangle, the May 20 peak was 2134.72 minus 1810.10 (the February 11 bottom) which yields 324.62, added to the July 6 wave "E" bottom of 2074.02 targets SPX 2398.64. When determining the best Elliott wave count among sometimes several alternate counts look at the evidence from the four market dimensions; price, time, momentum, and sentiment. My July 8th article "The Brexit Factor - Part Two" noted bullish evidence in all four market dimensions. This is the reason a Horizontal Triangle from May 20 - July 6 is the primary wave count and why we could see a powerful move to the upside over the next several weeks. |
|
| Figure 1. SPX Daily. The length of the post triangle thrust is approximately the widest part of the triangle. |
| Graphic provided by: BigCharts.com. |
| |
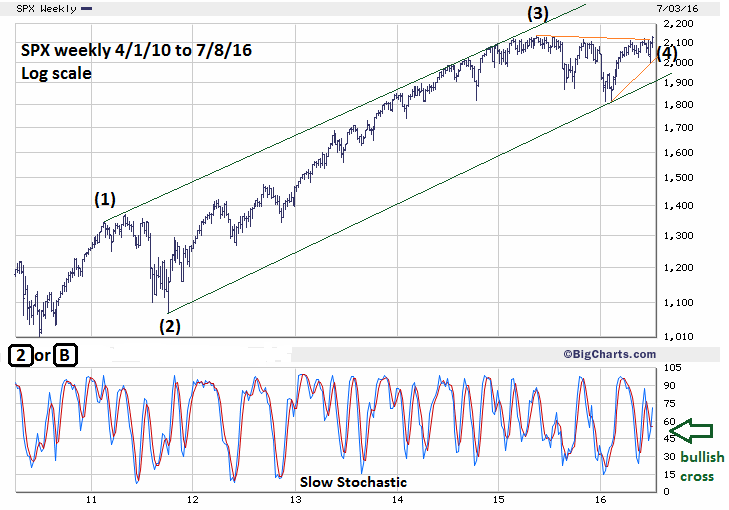
| S&P 500 - Long Term View Please see the weekly SPX chart illustrated in Figure 2. There appears to be a very clear Elliott five-wave pattern forming from the bottom made in 2010. If correct, then the supposed post triangle thrust up from the July 6th bottom is the fifth wave of that pattern. Wave "five" is usually equal to, or .618 of wave "one". The supposed wave "one" is interesting because the calculation can be made from either the February 2011 top at 1344.07, or the May 2011 top at 1370.58. What probably happened in 2011 is that a five-wave impulse ended in February 2011 and was followed by an Expanding Flat correction in which the middle part of the correction moved above the termination point of the impulse wave. The middle part of the correction in this case was the May peak of 1370.58. Because we're measuring waves separated by a large percentage gain of the SPX between 2010 and 2016, we compare each wave based on percentage gain rather than points. The entire move from the 2010 bottom to the high made in May 2011 is 35.5%. Now instead of calculating from the triangle wave "E" low, we make the calculation from the triangle low at the February 11th bottom labeled wave "A". A 35.5% gain from 1810.10 targets SPX 2452.68, a difference of 54.04 points from the target using the widest part of the triangle. The calculation from the February 2011 peak is a gain of 32.95%, which again using 1810.10 as the starting point targets SPX 2406.52 — only 7.88 points from the original target. What about calculating the percentage gain from the "E" wave termination point at 2074.02? If you multiply 35.5% by .618 it equals 21.98% which projected from 2074.02 targets SPX 2529.88. A 35.5% gain from 2074.02 targets SPX 2810.29. These two points are too far away from the primary target near 2400. Consider them alternate targets that we can come back to at a later date if necessary. |
|
| Figure 2. SPX Weekly. There appears to be a very clear Elliott five-wave pattern forming from the bottom made in 2010. |
| Graphic provided by: BigCharts.com. |
| |
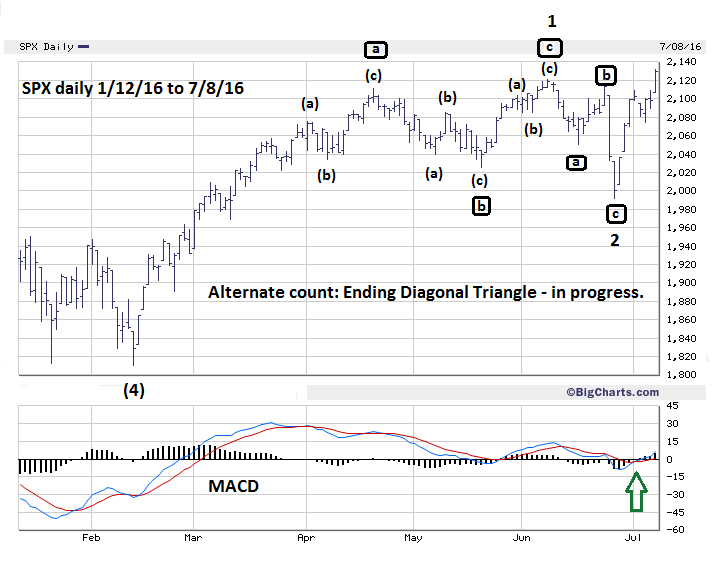
| S&P 500 - Alternate Wave Count Please see the daily SPX Alternate wave count illustrated in Figure 3. Two problems with the supposed Horizontal Triangle count are the size and shape of the waves "D" and "E". Size is not a significant problem because occasionally the final two waves of a Horizontal Triangle can be tiny relative to the other three sub waves. The larger problem is the supposed wave "D". Each sub wave of a Horizontal Triangle should subdivide into a corrective three-wave pattern. The four-day rally off of the June 27th bottom looks like an impulse wave. (For non-Elliotticians think impulse wave equals straight line vs. corrective wave equals crooked line.) If an Ending Diagonal Triangle (EDT) is in effect, then as of the July 8th close the SPX would be somewhere in the early part of wave "3" up. Occasionally, the relationship of wave "one" to waves "three" through "five" is .618. The supposed wave "1" was 310.45 SPX points multiplied by .618 equals 191.85 added to the wave "2" bottom at 1991.68 targets 2183.53, so the EDT could peak somewhere around SPX 2200. If the SPX can break above 2134.72 and the subsequent rally is sluggish, this wave count will require greater scrutiny. |
|
| Figure 3. SPX Daily. If the SPX can break above 2134.72 and the subsequent rally is sluggish, this wave count will require greater scrutiny. |
| Graphic provided by: BigCharts.com. |
| |
| Summary With bullish evidence in all four market dimensions the probabilities are high that the rally in US stocks could continue, it's a matter of degree as to how far or fast. If a post triangle thrust is underway it could resemble the February 11-April 20 rally. If so, there could be a significant peak around SPX 2400 sometime in the first half of September. SPX 1991.68 remains very important support. Continue using that level as a stop loss for half of your long positions. Fasten your seat belts. The move up from June 27th could be the beginning of several weeks in which stocks soar to the heavens. Further reading: Frost A.J and Robert Prechter (1985) "Elliott Wave Principle", New Classics Library. |
Independent investment advisor, trader and writer. He has written articles for Technical Analysis of Stocks & Commodities, Traders.com Advantage,Futuresmag.com and, Finance Magnates. Author of website Four Dimension Trading.
| Website: | www.fourdimensiontrading.com |
| E-mail address: | markrivest@gmail.com |
Click here for more information about our publications!
PRINT THIS ARTICLE

Request Information From Our Sponsors
- StockCharts.com, Inc.
- Candle Patterns
- Candlestick Charting Explained
- Intermarket Technical Analysis
- John Murphy on Chart Analysis
- John Murphy's Chart Pattern Recognition
- John Murphy's Market Message
- MurphyExplainsMarketAnalysis-Intermarket Analysis
- MurphyExplainsMarketAnalysis-Visual Analysis
- StockCharts.com
- Technical Analysis of the Financial Markets
- The Visual Investor
- VectorVest, Inc.
- Executive Premier Workshop
- One-Day Options Course
- OptionsPro
- Retirement Income Workshop
- Sure-Fire Trading Systems (VectorVest, Inc.)
- Trading as a Business Workshop
- VectorVest 7 EOD
- VectorVest 7 RealTime/IntraDay
- VectorVest AutoTester
- VectorVest Educational Services
- VectorVest OnLine
- VectorVest Options Analyzer
- VectorVest ProGraphics v6.0
- VectorVest ProTrader 7
- VectorVest RealTime Derby Tool
- VectorVest Simulator
- VectorVest Variator
- VectorVest Watchdog