

HOT TOPICS LIST
- MACD
- Fibonacci
- RSI
- Gann
- ADXR
- Stochastics
- Volume
- Triangles
- Futures
- Cycles
- Volatility
- ZIGZAG
- MESA
- Retracement
- Aroon
INDICATORS LIST
LIST OF TOPICS
PRINT THIS ARTICLE
by Mark Rivest
Could the S&P 500 reach an intermediate peak on July 25, 2016? Technical analysis has some very interesting clues.
Position: N/A
Mark Rivest
Independent investment advisor, trader and writer. He has written articles for Technical Analysis of Stocks & Commodities, Traders.com Advantage,Futuresmag.com and, Finance Magnates. Author of website Four Dimension Trading.
PRINT THIS ARTICLE
ELLIOTT WAVE
How to Trade Defensively - Part Two
08/03/16 04:36:56 PMby Mark Rivest
Could the S&P 500 reach an intermediate peak on July 25, 2016? Technical analysis has some very interesting clues.
Position: N/A
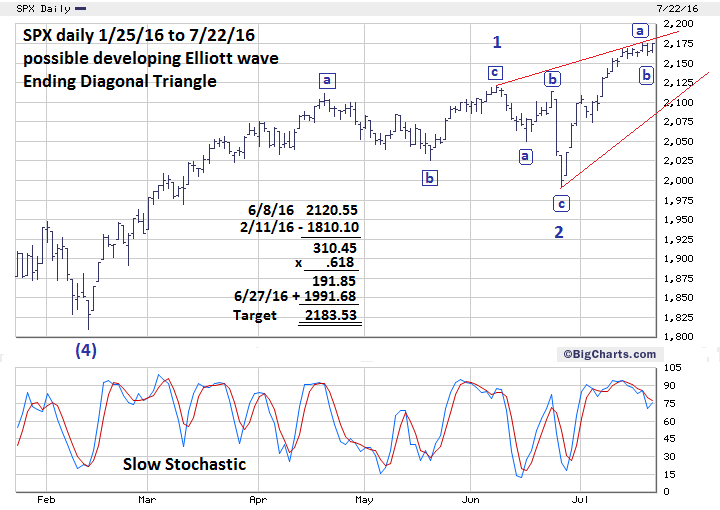
| In my last article, "How to Trade Defensively", I speculated the S&P 500 (SPX) could be forming an Elliott wave Ending Diagonal Triangle (EDT). It appeared that third wave of the EDT was completed at the July 15th top. This wave count wave was invalidated with the new high on July 20th, however subsequent price movements since July 20th have left open the possibility that the third wave of the EDT could still be under construction. An examination of the SPX in 2016 and its history over the last three years offers hints that an intermediate top could come in the last week of July. S&P 500 In 2016 Please see the daily SPX chart illustrated in Figure 1. Each sub wave of an EDT subdivides into three wave patterns. When the SPX made a new high on July 20th this changed the wave count to five from the June 27th bottom. Five waves up from June 27th could mean that only wave "a" (the first of three waves) of the EDT was complete. The SPX went down on July 21st then went up on July 22nd getting very close to the high of 2175.63 made on the 20th. The decline on July 21st could be wave "b" of the EDT third wave, therefore making the subsequent rally wave "c" (the last of the three waves). Normally, considering the size of the supposed wave "a" you would expect wave "b" to last longer than one day, however the SPX is approaching some very interesting Fibonacci price and time targets. The supposed third wave of the EDT would have a Fibonacci relationship of .618 of the first wave at SPX 2183.53, which could be reached in as little as one trading day, making July 25th a target day. In several articles I've noted the SPX was moving in time segments related to the Fibonacci sequence. The last target date was July 15th which is 13 trading days after the June 27th bottom. The subsequent move above the July 15th peak invalidated this target date. The next number in the Fibonacci sequence is 21 trading days after the June 27th bottom and targets July 27th as a possible intermediate top. Another Fibonacci time forecasting technique measures the time of the supposed wave one of the EDT. From the SPX 2016 low made on February 11th, adding 81 trading days equals the peak made on June 8th. Multiplying 81 by the Fibonacci ratio .236 equals 19 trading days. Adding 19 trading days to the June 27th bottom targets July 25th. |
|
| Figure 1. Each sub wave of a EDT subdivides into three wave patterns. |
| Graphic provided by: BigCharts.com. |
| |
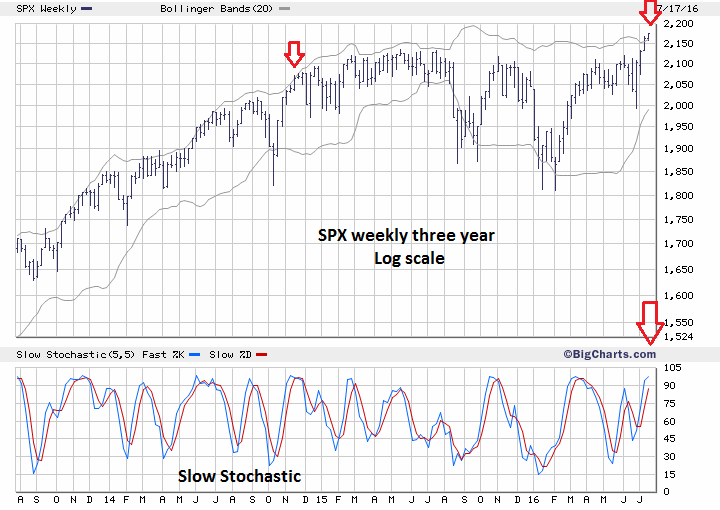
| S&P 500 From 2013-2016 Please see the weekly SPX chart illustrated in Figure 2. Something has happened on the weekly SPX chart that hasn't occurred since November 2014, and that is the weekly price bar is above the upper Bollinger band. In fact, it's the second consecutive week above the Bollinger band. Breaks above the upper band can indicate a peak or an approaching peak. A note of caution — sometimes there can be consecutive breaks of three, four, five or even six bars before prices reverse. Note that the upper line of the Slow Stochastic is above 90%, hinting at an approaching top. |
|
| Figure 2. A break above the weekly Bollinger band has not occurred since November 2014. |
| Graphic provided by: BigCharts.com. |
| |
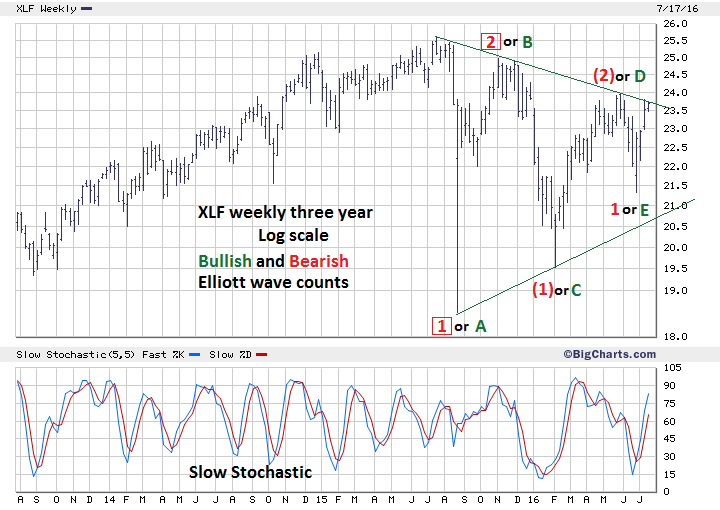
| Financial Select Sector SPDR Fund (XLF) Please see the weekly XLF chart illustrated in Figure 3. My July 21st article noted that the XLF was underperforming the SPX, and this underperformance has continued. The most recent XLF peak was on July 14th. When the SPX made a new rally high on July 20th the XLF failed to exceed its July 14th top. The weekly chart shows two Elliott wave counts. The bullish count has a completed Horizontal Triangle pattern from the July 2015 high. If this is the correct count, then the move up from the June 27th bottom is just the beginning of a larger move up that could eventually exceed the July 2015 peak. The bearish count is a series of "ones" and "twos". If this is the correct count, in a few weeks, the XLF could have a very sharp and deep move to the downside that could eventually exceed the August 2015 low. Because the XLF continues to lag the SPX, the bearish count is currently the most likely scenario. The XLF moving above its May 31st high at 23.93 would be a major clue that the bulls are in control. |
|
| Figure 3. Because of the XLF continues to lag the SPX, the bearish count is currently the most likely scenario. |
| Graphic provided by: BigCharts.com. |
| |
| Strategy As of July 22nd, the SPX is at an intersection. Does it want to move decisively above important resistance at 2183 or go into an intermediate decline? Continue holding 100% long. Maintain the stop loss for half of the position at SPX 2120.55 and the other half at SPX 1991.68. The great trader, Jesse Livemore, said he made his money by sitting, not thinking. Now's the time to sit and wait for the market to give us clues as to which direction it will take. We may not have to wait very long. Further Reading: Frost A.J and Robert Prechter (1985) "Elliott Wave Principle", New Classics Library. |
Independent investment advisor, trader and writer. He has written articles for Technical Analysis of Stocks & Commodities, Traders.com Advantage,Futuresmag.com and, Finance Magnates. Author of website Four Dimension Trading.
| Website: | www.fourdimensiontrading.com |
| E-mail address: | markrivest@gmail.com |
Click here for more information about our publications!
Comments
Date:�08/03/16Rank:�5Comment:�good article thank you.. also i m learning about Fibo little by little
thanks
Angel

Request Information From Our Sponsors
- StockCharts.com, Inc.
- Candle Patterns
- Candlestick Charting Explained
- Intermarket Technical Analysis
- John Murphy on Chart Analysis
- John Murphy's Chart Pattern Recognition
- John Murphy's Market Message
- MurphyExplainsMarketAnalysis-Intermarket Analysis
- MurphyExplainsMarketAnalysis-Visual Analysis
- StockCharts.com
- Technical Analysis of the Financial Markets
- The Visual Investor
- VectorVest, Inc.
- Executive Premier Workshop
- One-Day Options Course
- OptionsPro
- Retirement Income Workshop
- Sure-Fire Trading Systems (VectorVest, Inc.)
- Trading as a Business Workshop
- VectorVest 7 EOD
- VectorVest 7 RealTime/IntraDay
- VectorVest AutoTester
- VectorVest Educational Services
- VectorVest OnLine
- VectorVest Options Analyzer
- VectorVest ProGraphics v6.0
- VectorVest ProTrader 7
- VectorVest RealTime Derby Tool
- VectorVest Simulator
- VectorVest Variator
- VectorVest Watchdog